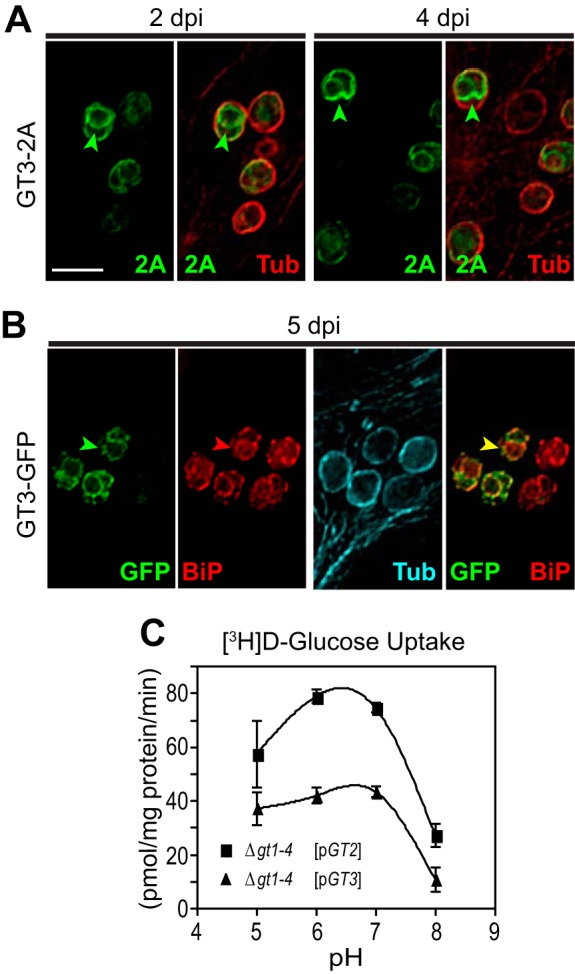
FIG 6 .

Expression of GT3 in amastigotes. (A) Amastigotes expressing GT3-2A were imaged inside THP-1 host macrophages at 2 and 4 days postinfection (dpi) by deconvolution microscopy to detect the 2A-tagged fusion protein (green) or α-tubulin (red). Arrowheads designate intracellular fluorescence for GT3-2A. Bar, 5 µm. (B) At 5 dpi, intracellular amastigotes expressing the GT3-GFP fusion protein were stained with anti-GFP antibody (green), with antibody to BiP (red), and with antibody to α-tubulin (cyan). Green arrowheads indicate intracellular GT3-GFP, red arrowheads are the BiP marker for the ER, and the yellow arrowhead indicates costaining of GFP and BiP. Bar, 5 µm. (C) Uptake of 100 µM d-[3H]glucose by GT2 and GT3 as a function of pH. Rates of uptake were measured in triplicate, and data points represent the means and standard deviations (error bars). Cell lines employed were the glucose transporter null mutant Δgt1-4 (16) encompassing either the GT2 ([pGT2]) or GT3 ([pGT3]) open reading frame in an episomal expression vector.
