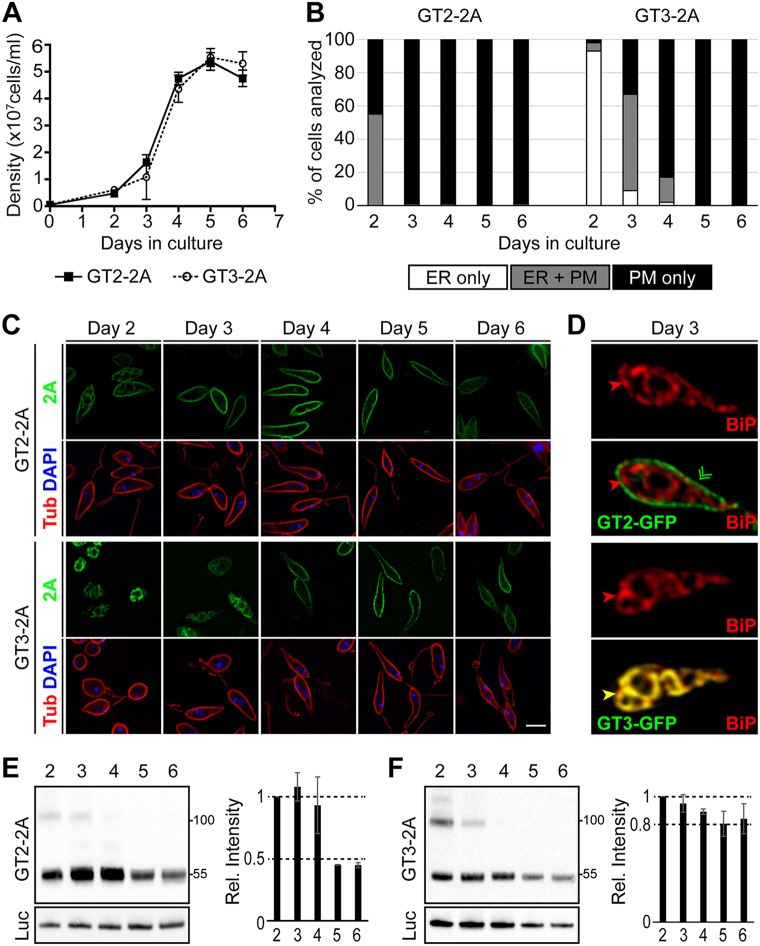
FIG 7 .
Localization of GT2 and GT3 in promastigotes. (A) Growth curves for wild-type L. mexicana promastigotes expressing the GT2-2A and GT3-2A proteins generated from cotranslational cleavage from luciferase fusion proteins. Cell densities were determined from 2 separate cultures. The cell density of each culture was determined by replicate measurements, which were then averaged, and the mean and range (error bars) of the averages from the 2 experiments were plotted. (B) Promastigotes expressing either GT2-2A or GT3-2A were removed from each culture daily and imaged by deconvolution microscopy employing the anti-2A antibody. Individual cells (>150 for each time point) were scored for localization of the tagged protein in the ER only, the ER plus plasma membrane (PM), or the plasma membrane only, and the percentage of cells in each group was plotted. (C) Fields of parasites prepared as described for panel B were imaged by deconvolution microscopy following staining with antibody to the 2A epitope (green), antibody to α-tubulin (red), and DAPI (blue). Bar, 5 µm. (D) A parasite expressing GT2-GFP (top 2 panels) from a day 3 culture (cell density, ~1 × 10⁷ cells/ml) was imaged using antibody to BiP (red) and to GFP (green). The merged image (second panel from the top) demonstrates localization of the transporter on the cell surface and no overlap with BiP. A parasite expressing GT3-GFP (bottom 2 panels) from a day 3 culture was imaged with antibody to BiP (red) and to GFP (green). The merged image (bottom-most panel) shows yellow color indicating extensive overlap between GT3-GFP and BiP. Bar, 5 µm. (E) Western blot of lysates from parasites expressing GT2-2A, generated from a luciferase fusion construct, at days 2 to 6 of growth. The top panel was developed with anti-2A antibody, and the bottom panel was developed with antiluciferase antibody. Two separate experiments were performed, the intensity of the signals was determined by scanning the developed blot, and the average and range of the two relative intensities at each day were plotted, setting the day 2 intensity to a value of 1. Molecular weight markers in kilodaltons are shown at the right. (F) Western blot as in panel E for parasites expressing GT3-2A. The bands at ~100 kDa on the blots in panels E and F may represent dimers of the transporters that have remained intact during electrophoresis on SDS gels.

