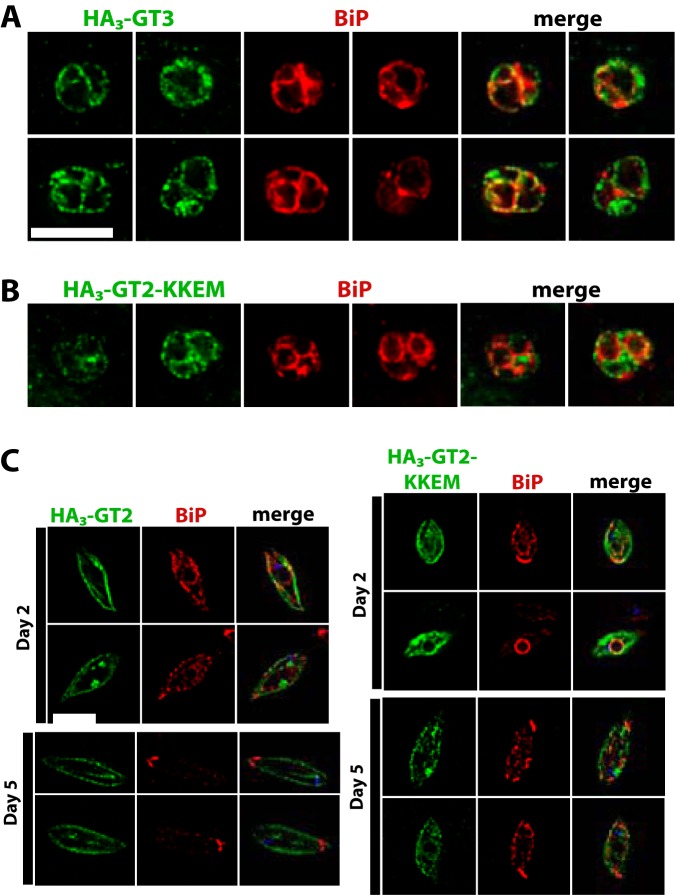
FIG 9 .
Trafficking of GT2 and GT3 glucose transporters tagged with the HA3 epitope at the amino-terminal end. In all images, green represents the secondary immunofluorescence signal of the relevant permease, red represents secondary immunofluorescence corresponding to the ER protein BiP, and “merge” shows the overlap of the green and red signals. (A) Intracellular amastigotes expressing HA3-GT3. (B) Intracellular amastigotes expressing HA3-GT2-KKEM, where KKEM is the ER targeting motif. (C) Promastigotes expressing HA3-GT2 (left panels) and HA3-GT2-KKEM (right panels). Images were taken on day 2 (~1 × 10⁶ cells/ml, top panels) and day 5 (~1 × 10⁷ cells/ml, bottom panels) of culture to capture parasites in low and high density. Bars, 6 µm; the bar in panel A also represents the scale for panel B.

