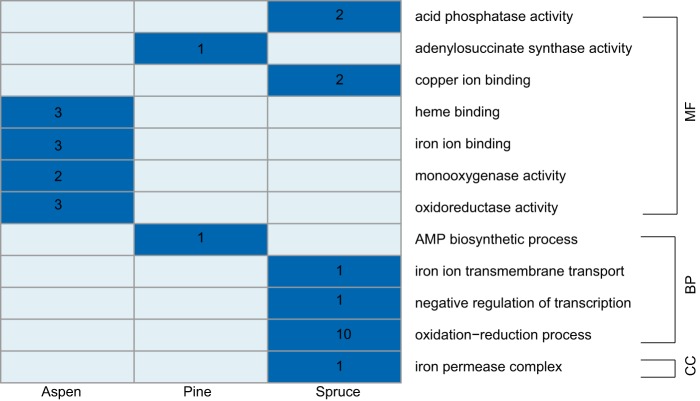
FIG 2.
GO enrichment of upregulated genes from each substrate after 5-day submerged incubation. Categories of GO terms are labeled on the right side of the heatmap. Substrates are labeled at the bottom. Dark blue shading indicates presence and light blue indicates absence. The number of genes in each GO term is labeled in dark blue.

