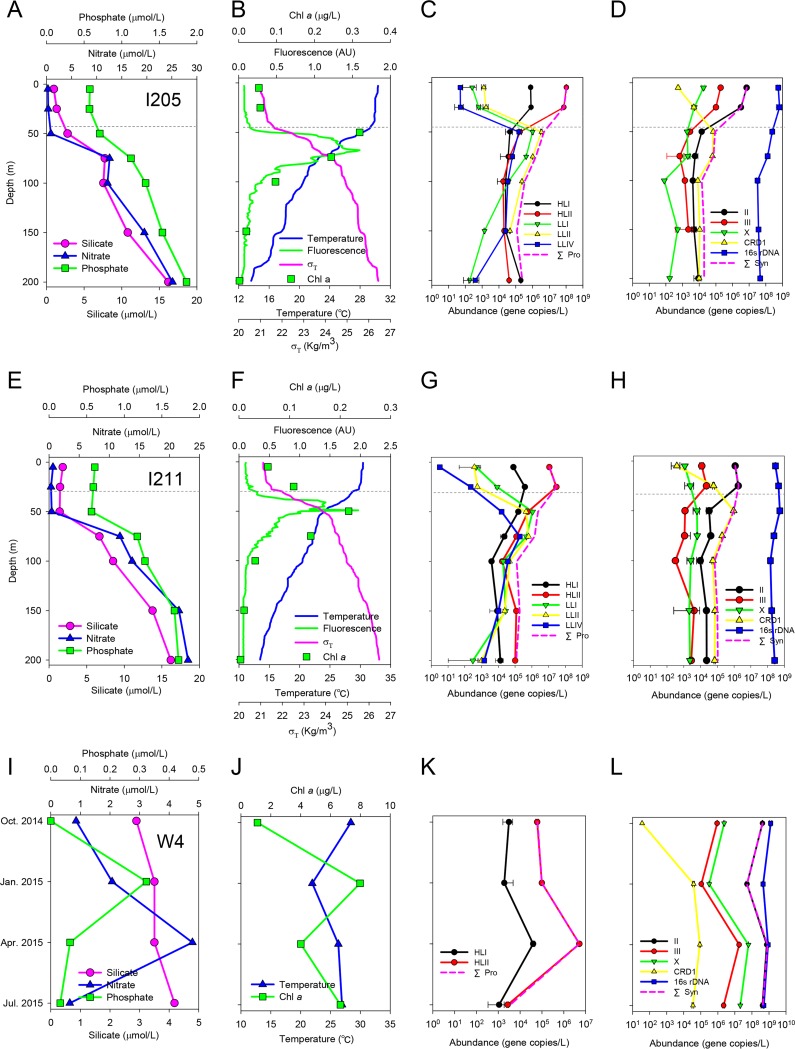
FIG 1.
Hydrographic features (A, B, E, F, I, and J) and abundances of Prochlorococcus (C, G, and K) and Synechococcus (D, H, and L) ecotypes at Indian Ocean stations I205 (A to D) and I211 (E to H) and Sanya Bay station W4 (I to L). Hydrographic parameters include concentrations of macronutrients and chlorophyll a, fluorescence intensity, water temperature, and water density (σT). The mixing layer depth is indicated by gray dashed lines. Abundances of 14 Prochlorococcus and Synechococcus ecotypes and total bacteria (16S rRNA gene copies) were measured, but only the detectable ecotypes are shown. Pink dashed lines (C, D, G, H, K, and L) indicate summed ecotype abundance. Note that, in panel L, the black line representing Synechococcus clade II overlaps the pink line representing total Synechococcus.

