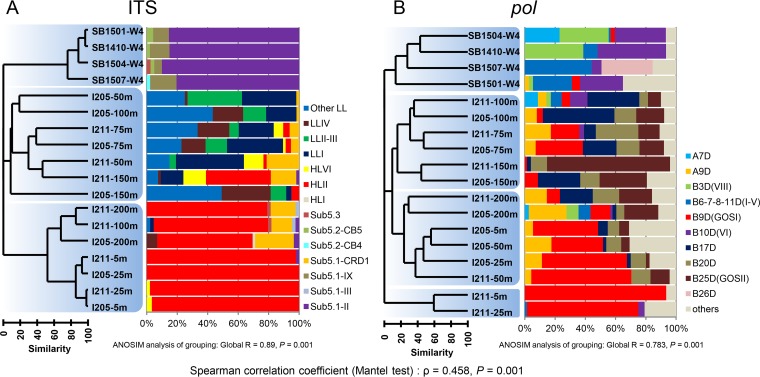
FIG 2.
Clustering of the samples on the basis of compositions of ITS (A) and pol sequences (B). OTU was defined at a cutoff of 90% DNA sequence similarity for both ITS and pol. ANOSIM was used to test the significance of the grouping, which is indicated by light blue shading in the clustering dendrograms. Phylotype-based community composition of each sample is shown to the right of the dendrograms. Spearman correlation coefficient (Mantel test) that reflects the relationship between picocyanobacterial and cyanopodoviral communities is shown below the chart. “Other LL” Prochlorococcus does not represent a real clade but is comprised of other sequences that cannot be assigned to any known LL lineages.

