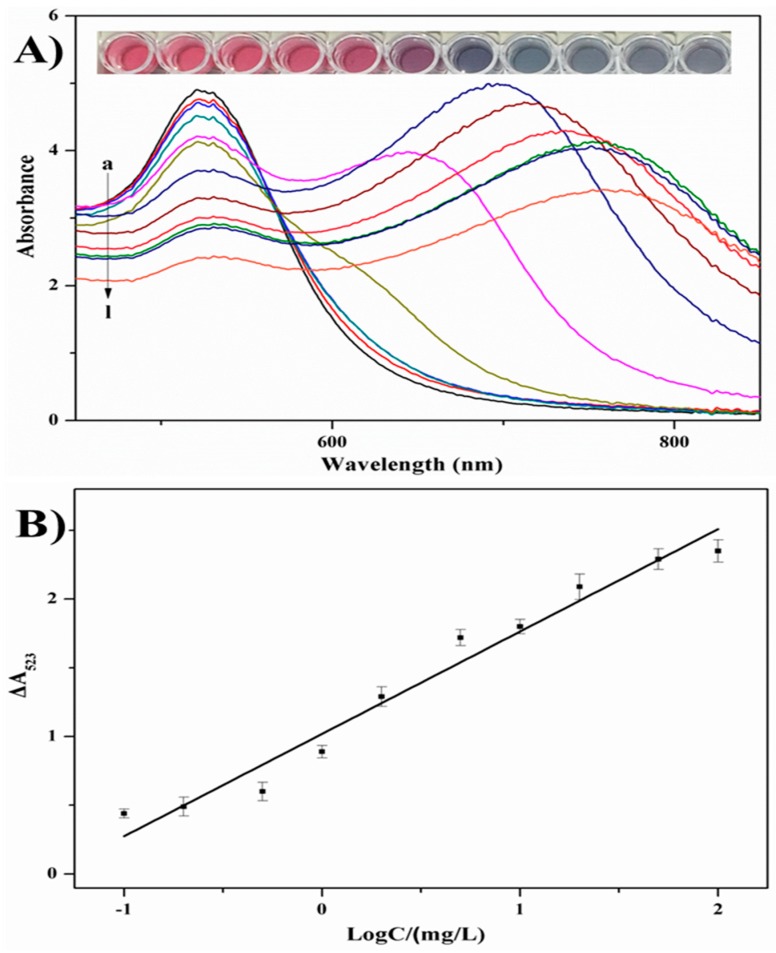
Figure 6.
(A) UV-Vis spectra and a photograph of (a) AuNP solutions, AuNP solutions with concentrations of chlorsulfuron of (b) 100 mg/L , (c) 50 mg/L, (d) 20 mg/L, (e) 10 mg/L, (f) 5.0 mg/L, (g) 2.0 mg/L, (h) 1.0 mg/L, (i) 0.5 mg/L, (j) 0.2 mg/L, (k) 0.1 mg/L (l) 0 mg/L in the presence of 20 mg/L acetamiprid and (B) standard calibration curve of the absorbance change of AuNPs at 523 nm (ΔA523) against chlorsulfuron concentration.

