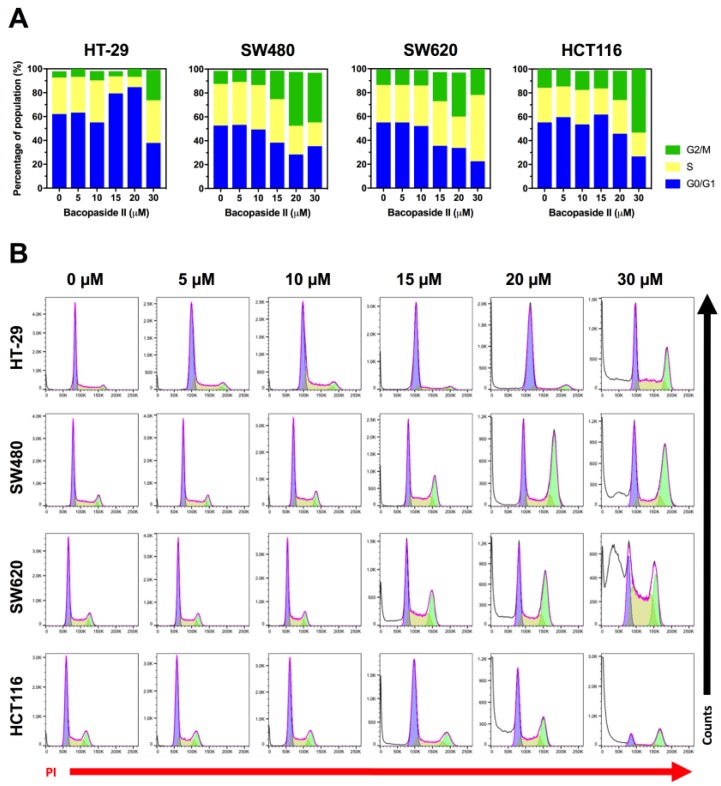
Figure 4.
Effect of bacopaside II on cell cycling. Cells were treated with bacopaside II for 24 h, the DNA was stained with propidium iodide, and analysed by flow cytometry. (A) The percentage of population of single cells in G0/G1, S and G2/M phases of the cell cycle. (B) Representative histograms of the PI stained DNA, showing the subG1 events (white), G0/G1 (blue), S (yellow) and G2/M (green). Results shown are representative of 3 repeated experiments.

