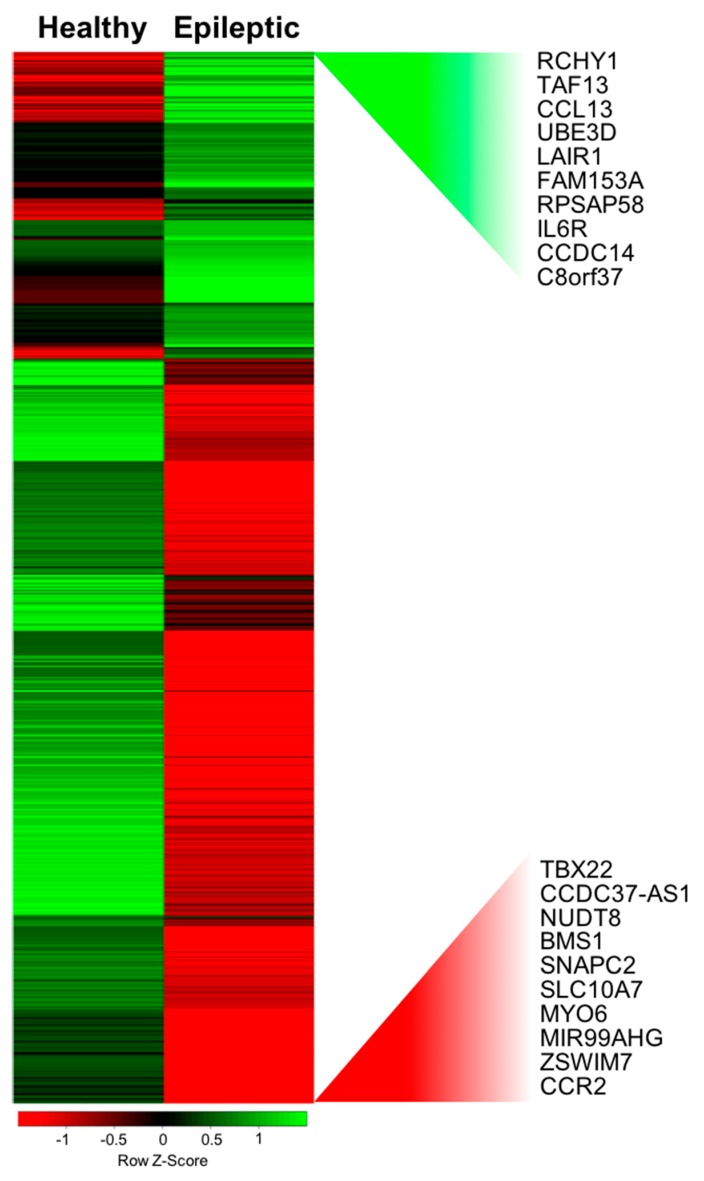
Figure 1.
Gene expression changes triggered by epileptic disease. Microarray heat map shown genes that were differentially expressed and unchanged during epileptic episodes without treatment. A color code scale was used to show gene expression differences in logarithmic fold change units between the groups (red represents lower expression; green represents higher expression).

