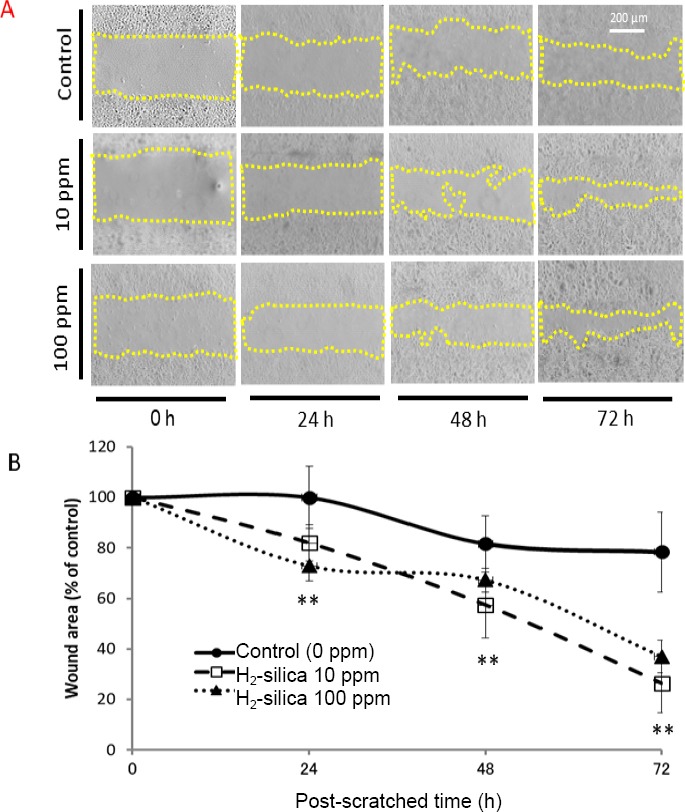
Figure 1.

Time-lapse changes to cell migration of HEEpiCs after the wound healing assay.
Note: (A) Images of wounds in HEEpiCs at 0, 24, 48, and 72 hours (h) post-scratching. Bar: 200 μm (40× magnification). (B) Rates of wounded area relative to the start time of scratch shows the relationship between duration and hydrogenoccluding silica microparticles (H2-silica) at 0, 10, and 100 ppm. Data were expressed as the mean ± SD and evaluated with the repeated ANOVA analysis. **P < 0.01.
