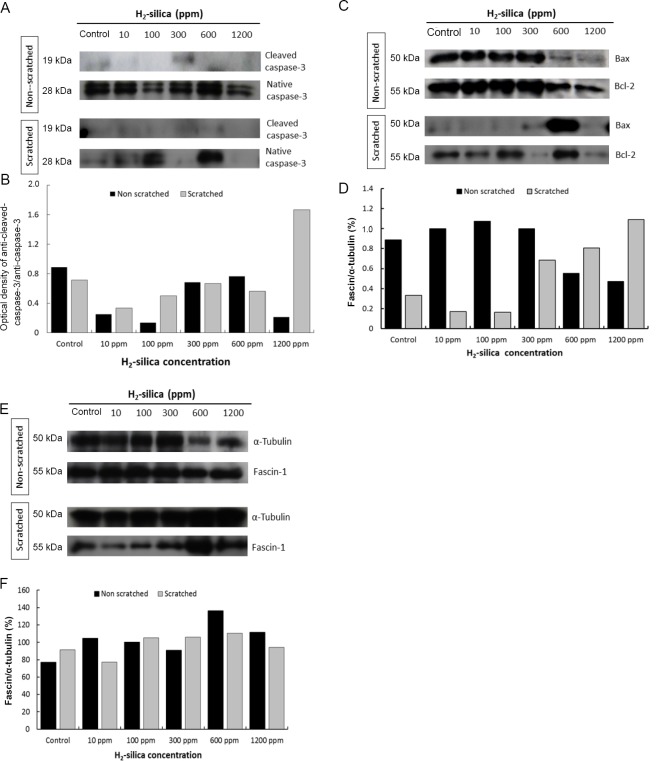
Figure 4.
Western blotting analysis of caspase-3, Bax/Bcl-2, α-tubulin, and fascin.
Note: (A, C, E) Immuno-detected bands for activated caspase-3 (19 kDa) and native caspase-3 (28 kDa) (A), Bax (19 kDa) versus Bcl-2 (28 kDa) (C), and fascin-1 (55 kDa) versus α-tubulin (50 kDa) (E) for the non-scratched group and the scratched group at 0 ppm (control), 10, 100, 300, 600, and 1200 ppm concentrations of H2-silica in HEEpiCs. The ratios (%) of band optical densities and expression levels of activated caspase-3 versus native caspase-3 (B), Bax versus Bcl-2 (D), and α-tubulin/fascin-1 (F) for the non-scratched group and the scratched group at 0 (control), 10, 100, 300, 600, and 1200 ppm concentrations of H2-silica in HEEpiCs were analyzed by densitometry via the ImageJ software, respectively. H2-silica: Hydrogen-occluding silica microparticles.

