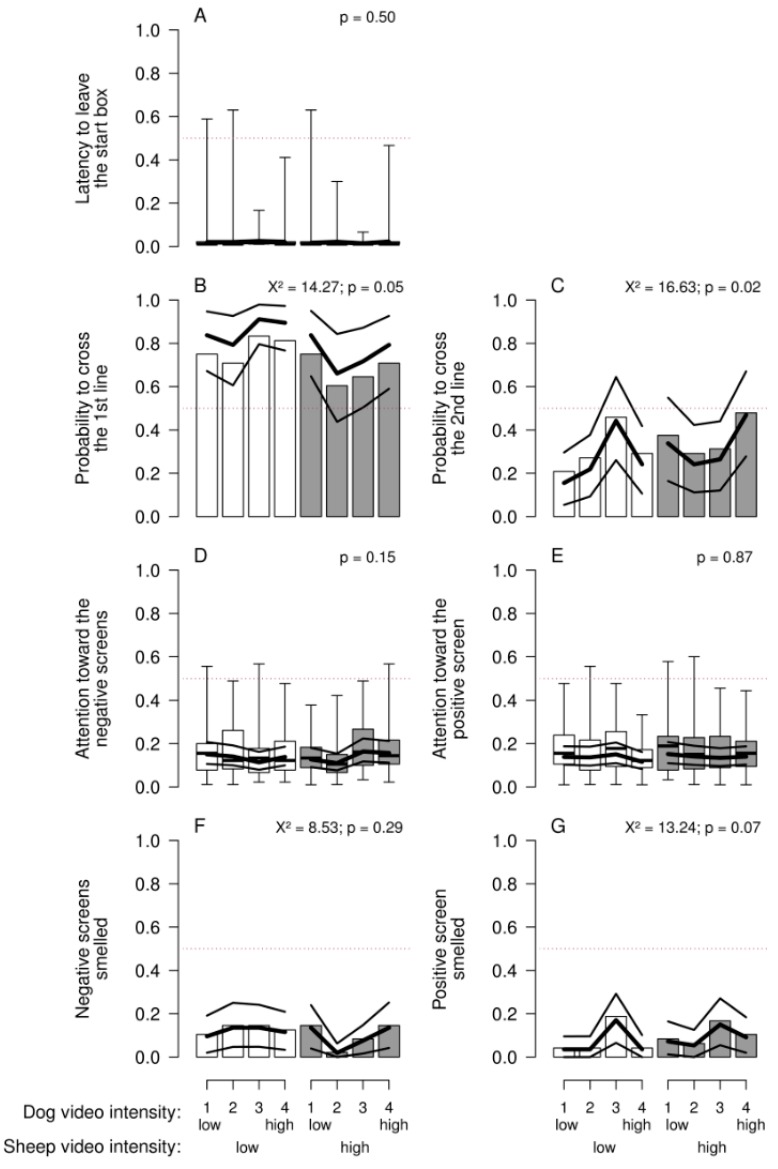
Figure 3.
Sheep’s reactions in the approach–avoidance paradigm according to the presumed intensity of the sheep (low: one sheep moving; high: several sheep moving) and dog videos (1 (low): one dog lying; 2: one dog sitting; 3: one dog moving; 4 (high): two dogs moving): (A) Latency to leave the start box (proportion of the trial duration); (B) probability that the first line was crossed; (C) probability that the second line was crossed; (D) proportion of trial duration with sheep’s attention towards the negative screens; (E) proportion of trial duration with sheep’s attention towards the positive screen; (F) probability that the negative screens were smelled; and (G) probability that the positive screen was smelled. Boxplots indicate data range as well as median, and lower and upper quartiles. Thick black lines are the model estimates (main effects plus interaction), and thin black lines are the 95% confidence intervals.

