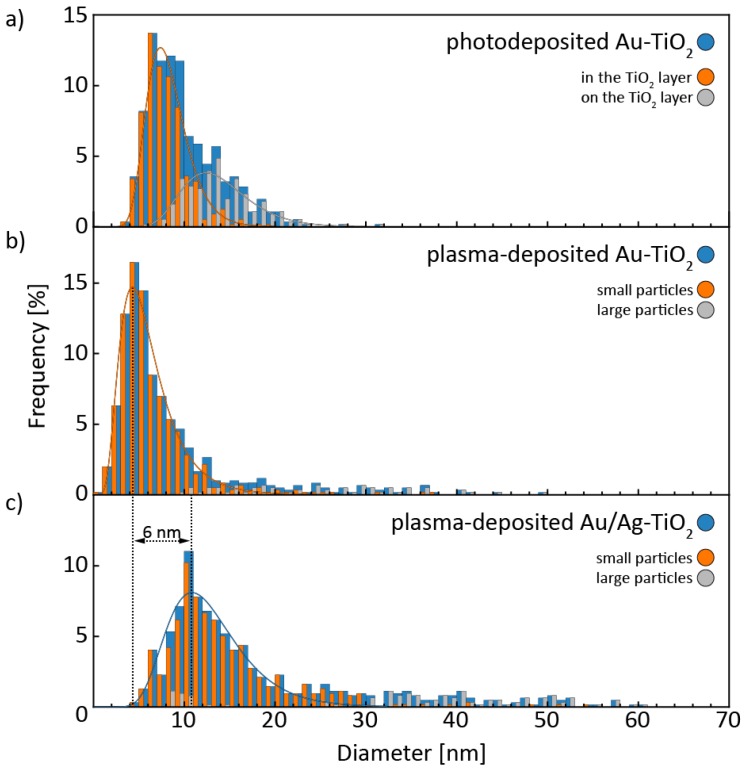
Figure 3.
Size distributions of the noble metal nanoparticles in (a) photodeposited Au-TiO2, (b) plasma-deposited Au-TiO2 and (c) plasma-deposited Ag/Au-TiO2. All size distributions were split into two sub-distributions each. As explained in the main text, “large particles” refers to particles we believe have coarsened, “small particles” to those that have not. Please note that the frequency values only apply to the size distribution of the whole sample, but not to the sub-distributions.

