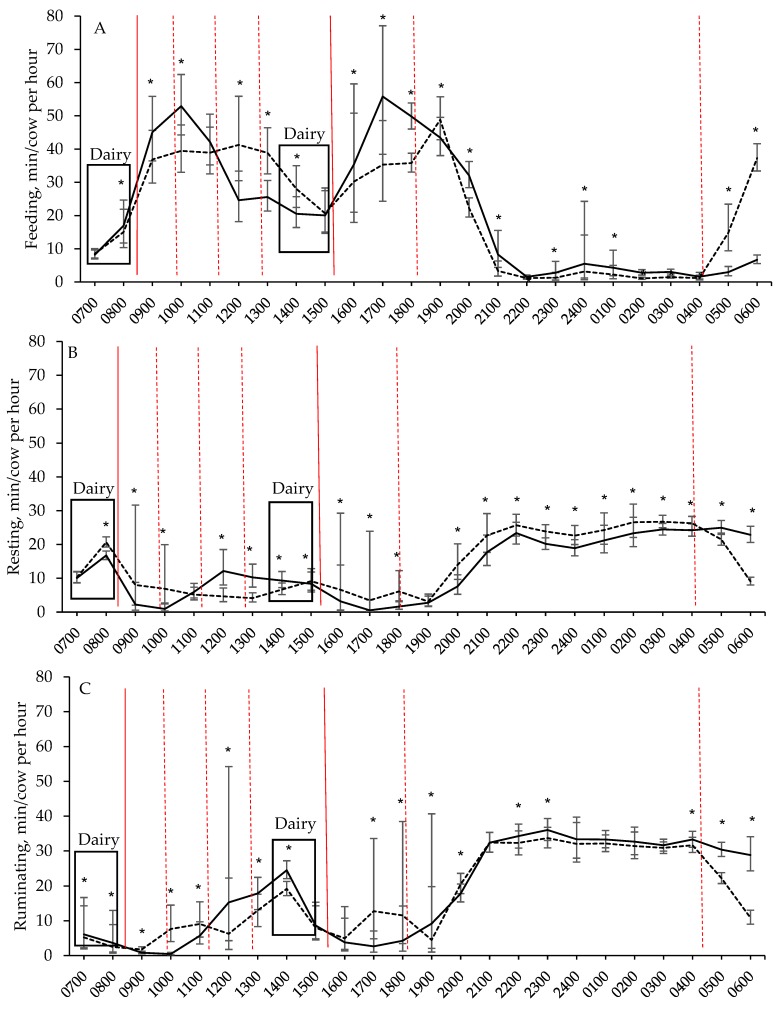
Figure 2.
The effects of providing cows their daily pasture allocation over 2 feeds per day (solid line) or 7 feeds per day (dotted line) on time (y-axis) spent (A) feeding, (B) resting, and (C) ruminating, over 24 h per day (x-axis). The approximate times that all cows gained access to fresh pasture are indicated by a solid red reference line, while the approximate times that feeds were provided only to cows fed 7 times per day are indicated by a dotted red reference line. Least square means ± 95% confidence interval, calculated using linear mixed models, are presented. Significant differences between treatments are indicated by * (p < 0.05).

