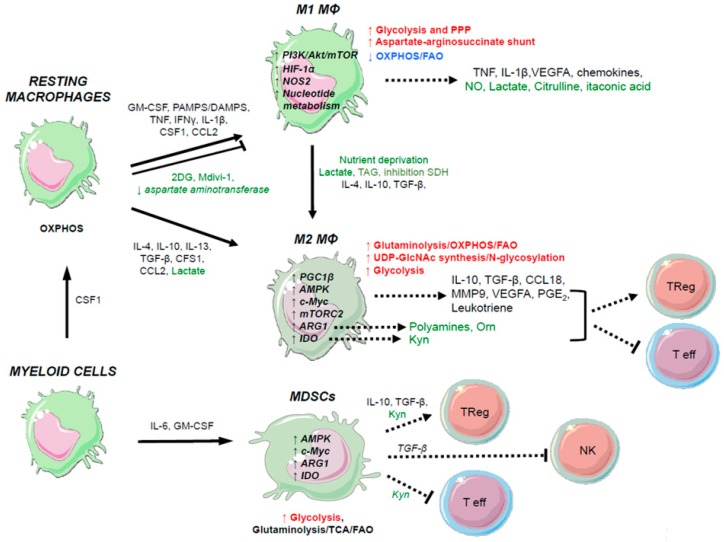
Figure 4.
Metabolic rewiring following activation of macrophages. Metabolic requirements are indicated for the differentiation of resting macrophages into M1, M2, or MDSCs. The primary metabolic pathways for each immune phenotype that are upregulated (red), downregulated (blue), or unchanged (black) are indicated. The primary metabolic markers involved in these pathways are indicated in bold black (metabolic enzymes or transcription factors) within immune cells depicted. Soluble immune markers that regulate these differentiation states are indicated in black (cytokines, growth factors, pathogens, danger signals), and those related to cell metabolism (macromolecules, metabolites, pharmacological agents) are indicated in green. Green arrows indicate the modulation of metabolic gene expression through overexpression or gene silencing. As described in this figure, the use of various metabolites or the modulation of metabolic gene expression within macrophages summarized here (in green) can lead to skew the phenotype and polarization of immune cells, and thereby modulating their immune functions. For example, the treatment of resting macrophages by the metabolite 2DG or the down-regulation of aspartate aminotransferase gene expression, can impair their activation into M1 macrophages. 2DG, 2-deoxy-d-glucose; PI3K, phosphoinositide 3-kinase; Akt, protein kinase B; mTOR, mammalian target of rapamycin; HIF-1α, hypoxia-inducible factor 1-alpha; NOS2, nitric oxide synthase 2; AMPK, AMP-activated protein kinase; ARG1, arginase 1; IDO1, indoleamine 2,3-dioxygenase 1; Orn, ornithine; Kyn, kynurenine; TCA, tricarboxylic acid cycle.

