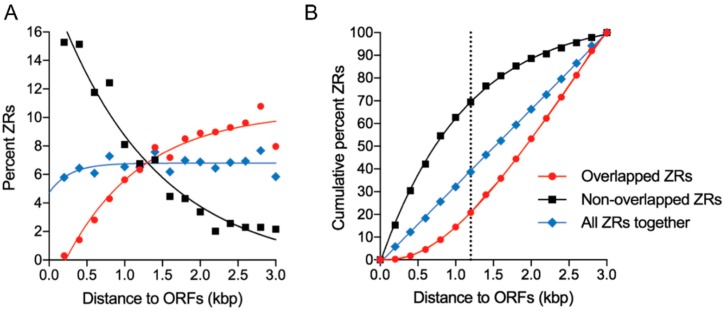
Figure 8.
Distribution of ZR motifs at a genome scale in the upstream regions of the predicted open reading frames (ORFs). (A) Representation of the percentage of ZR motifs (overlapped, non-overlapped and all together) with respect to their distance to the predicted translation start codons (TSC) of the ORFs; (B) representation of the cumulative percent of ZR motifs with respect to their distance to the predicted translation start codons of the ORFs. The dotted line indicates the average size of the DNA sequence that is located upstream of the predicted TSCs containing the ZR motifs with the highest probability of being involved in regulating gene expression (i.e., the functionally relevant ZR motifs). In both graphs, the distance of the ZR motifs to the ORFs represented on the x-axes was divided into 15 fractions of 200 bp each.

