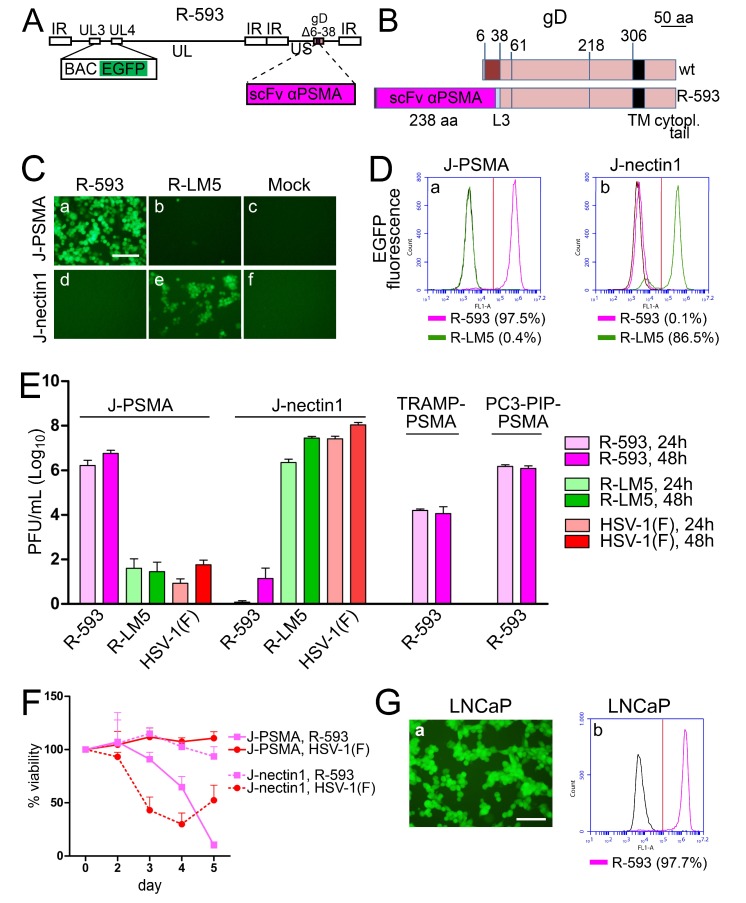
Figure 2.
Properties of PSMA-retargeted R-593. (A) Schematic drawing of the R-593 genome. Inverted repeat (IR) sequences are represented as rectangular boxes. The scFv to PSMA is inserted in gD, in place of aa 6–38. pBeloBAC11 and EGFP (BAC EGFP) are inserted between UL3 and UL4 [50]. (B) Schematic linear maps of R-593 gD, and of wt gD. The aa coordinates relevant to this study are indicated. The two linear maps are drawn to scale. Scale bar, 50 amino acid residues. Note that the size of R-593 gD is almost doubled relative to that of wt gD, as a consequence of scFv insertion. L3, linker 3. (C) J-PSMA or J-nectin1 cell lines were infected with the indicated viruses at 10 PFU/cell. Pictures were taken at 24 h p.i. The levels, brightness, and contrast of the panels were adjusted by means of Adobe Photoshop as follows: input level (black) 30, brightness +60, contrast +60, scale bar =100 µm. (D) J-PSMA or J-nectin1 cells exposed to 10 PFU/cell of R-593 or R-LM5 or mock infected (black line); at 24 h after infection, the infected cells were analyzed for EGFP fluorescence by flow cytometry. The figures next to each virus name indicate the percentage of infected cells. Vertical red line: threshold discriminating the negative and positive populations, as determined by comparison with the negative control. (E) R-593 replication in J-PSMA, J-nectin1, or the PSMA-expressing prostate murine (TRAMP-PSMA) or human (PC3-PIP-PSMA) tumor cell lines. Cells were infected at 0.1 PFU/cell, and harvested at 24 or 48 h after infection. The plotted values represent the average of three independent experiments (for J-PSMA and J-nectin1) or two independent experiments for TRAMP-PSMA and PC3-PIP-PSMA, ± SD. (F) Effect of virus infection on viability of J-PSMA (solid lines) or J-nectin1 (dashed lines) cells, infected at 2.5 PFU/cell. The data represent the average of four replicate samples ± SD. (G) R-593 infection of the human prostate cancer cell line LNCaP detected by fluorescence microscopy (panel a). Panel b shows the extent of infection as detected by flow cytometry. Vertical red line: threshold between negative and positive populations, scale bar = 100 µm.

