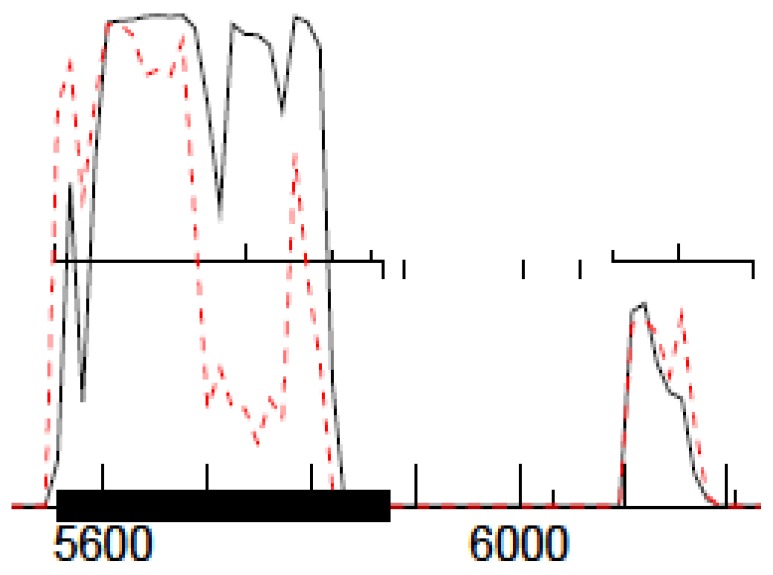
Figure 2.
Coding potential map for two open reading frames (ORFs), obtained from GeneMarkS [34]. In the figure, two ORFs are shown, one with strong coding potential (left, score: 5) and one with weak coding potential (right, score: 1). Upward ticks represent start codons, downward ticks represent stop codons, and horizontal lines between ticks indicate ORFs. The first ORF has four possible start codons, only one of which is located in front of the increase in coding potential (far left).

