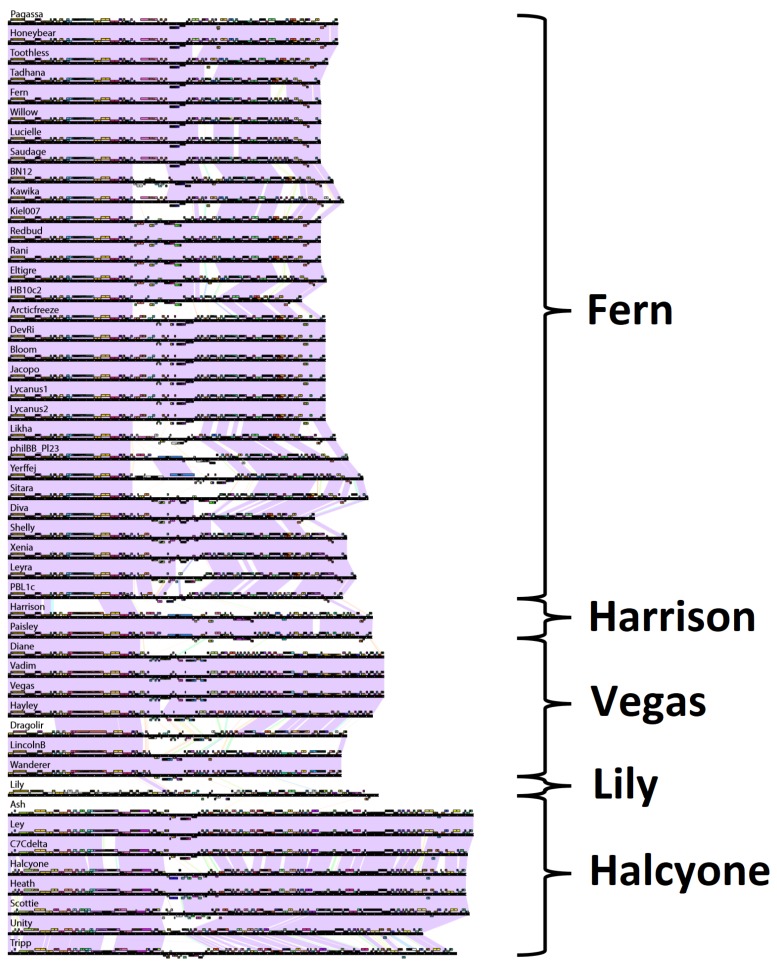
Figure 6.
Pairwise genome maps genomes generated with Phamerator. Boxes represent genes, with boxes of the same color indicating genes in the same pham. Genes in a pham of their own (orphams) are uncolored. Shaded areas between genomes indicate regions of high nucleotide sequence similarity between phages as determined by BLASTN, with purple indicating the highest degree of similarity (E-value = 0), and red the lowest (E-value = 1 × 10⁻⁴).

