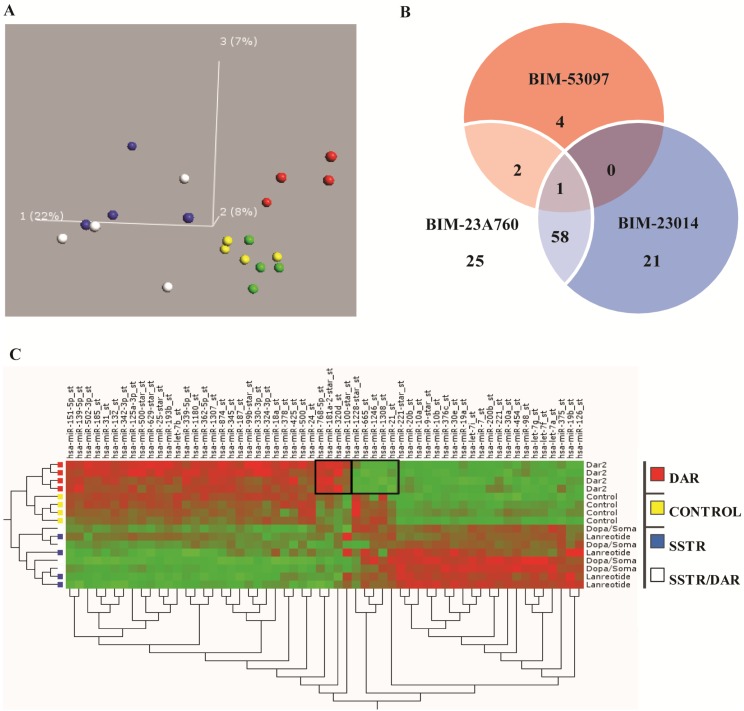
Figure 3.
PCA shows specific miRNA expression depending on receptor activation. (A) The unbiased PCA separates the samples based on variation in the expression of miRNA in each sample. In the first dimension samples treated with BIM-23014 (blue—SSTR agonist) and BIM- 23A760 (white—SSTR and dopamine receptor D2 (DRD2) chimeric agonist) separated from the others. BIM-23023 (green—SSTR) did not separate from the control (yellow). Also in the first dimension BIM-53097 (red—DRD2) did not separate from the controls. However, in the third dimension the BIM-53097 (red—DRD2) treated samples clearly separated from the controls. The percentage indicates how much of the total variation is present in each dimension. In this experiment 22% of the total variation of miRNA expression is found in the first dimension, 8% in the second and 7% in the third. The two most potent inhibitors of growth BIM-23A760 and BIM-23014 group together, the DRD2 agonist and the least effective growth inhibitor separates by itself. (B) The Venn diagram shows the miRNAs shared between the different analogue treatments and that the number of miRNAs shared between BIM-23A760 (SSTR-DRD2) and BIM-23014 (SSTR) are greater than BIM-53097 (DRD2). (C) On the right side of the map is the clustering of treatment where DRD2 and controls separate from chimeric compound BIM-23A760 (SSTR-DRD2) and BIM-23014 (SSTR). Furthermore it seems to separate controls and DRD2. Notice in the middle of the control/DRD2 treatment, there is a small fraction of miRNA which seems to be controlled by dopamine alone and different from the control group.

