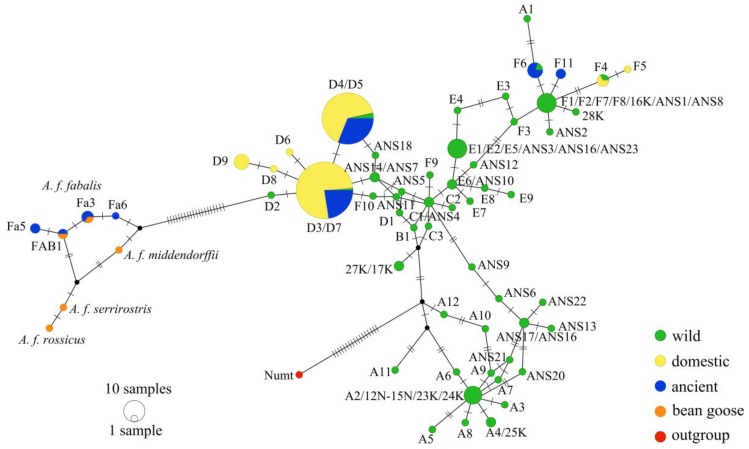
Figure 3.
Median-joining haplotype network of the concatenated hypervariable part of the mitochondrial control region (204 bp) of subfossil goose samples (ancient), modern domestic goose samples (domestic), modern wild greylag goose Anser anser haplotypes (wild), bean goose Anser fabalis haplotypes (bean goose), and nuclear sequence of mitochondrial origin, Numt (outgroup) sequences. Forward slashes between haplotype names denote haplotypes that differ over the whole control region sequence (1249 bp) but cannot be distinguished in the 204 bp sequence analyzed here. Circle area is proportional to the frequency of each haplotype and mutational steps between the haplotypes are indicated by tick marks across branches.

