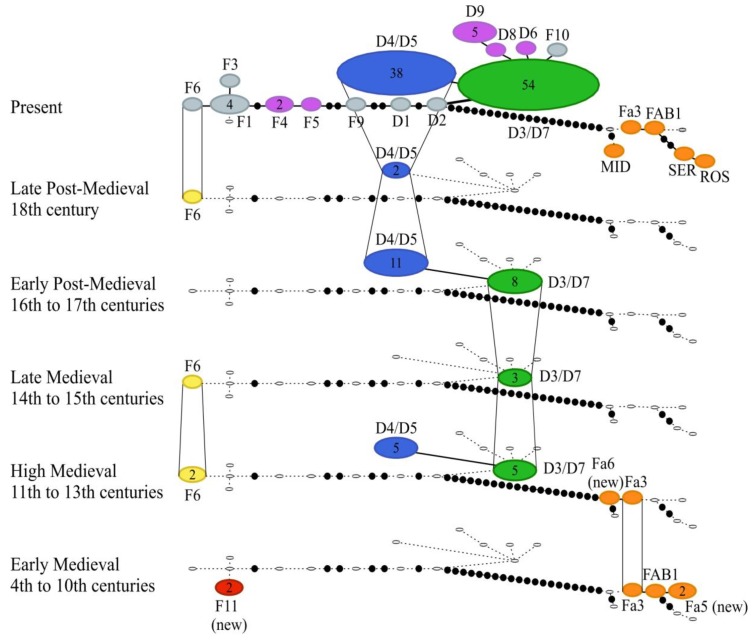
Figure 4.
Temporal statistical parsimony network of the concatenated hypervariable part of the mitochondrial control region (204 bp) of subfossil goose samples from Russia from the 4th to 18th century CE and modern greylag goose (Anser anser) haplogroups D and F. These groups contain the known domestic goose haplotypes D3 and D7 (green), D4–D5 (blue), and D6, D8–D9, and F4–F5 (purple), and the wild greylag goose in grey color in the depiction for the Present Period. Selected modern bean goose (Anser fabalis) haplotypes are also shown separated by at least 21 mutational steps from the others (orange color). MID, SER, and ROS denote the subspecies Anser fabalis middendorffii, Anser fabalis serrirostris, and Anser fabalis rossicus, respectively, while FAB and Fa denote Anser fabalis fabalis haplotypes. The size of each ellipse is proportional to the frequency of each haplotype and the number of individuals greater than one are indicated with a number within the ellipse. Small white ellipses indicate haplotypes absent in that time period. Number of black dots +1 connecting haplotypes equals to nucleotide differences.

