Figure 3.
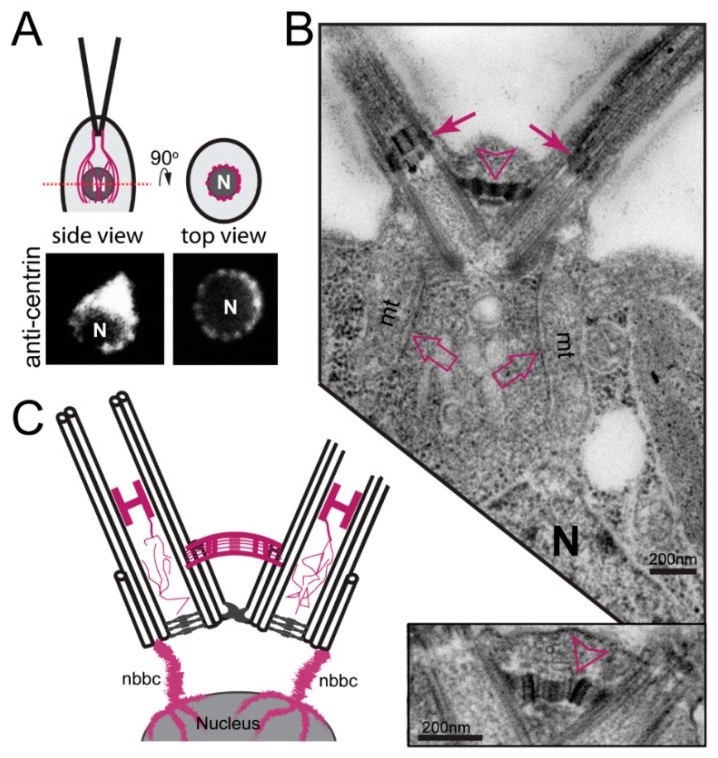
Distribution of centrin in C. reinhardtii. (A) top: Schematic presentation of cells with the nucleus and the centrin-based nucleus-basal body connectors (NBBCs) (mangenta). Bottom: anti-centrin staining in top (right) and side (left) view. The top view is a focal plane at the level of the nucleus showing the branches of the NBBCs. (B) An electron micrograph (EM) showing a longitudinal-section of the flagella, transition zones (closed arrows), and basal bodies. Open arrows point to the NBBCs. N, nucleus; open arrowhead, distal connecting fiber. The insert (bottom) shows the distal connecting fiber at higher magnification. (C) Cartoon of the centrin-based cytoskeleton (in magenta) of C. reinhardtii. See reference [58] for an outstanding analysis of the distribution of centrin in C. reinhardtii at the ultrastructural level.

