Figure 5.
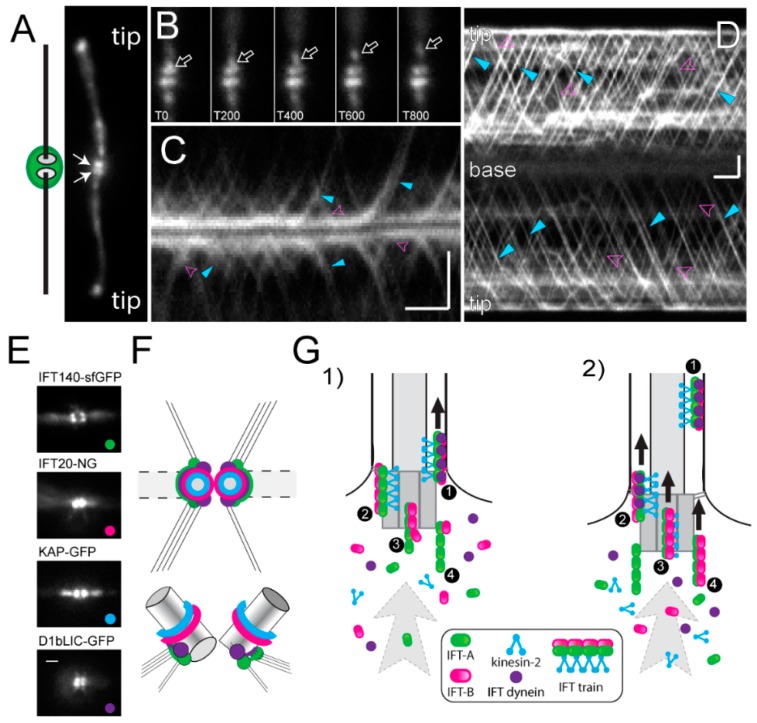
Basal bodies as organizer for IFT. (A) Overview and total internal reflection fluorescence (TIRF) image of a live cell expressing mNeonGreen-IFT54. The basal body pools (arrows) and the flagellar tips are marked. (B) Series of still images depicting the departure of an anterograde IFT train (arrow) from the basal body pool. T indicates the time in ms. (C) Kymogram (plot of time vs. position) showing the departure and arrival of IFT trains at the flagellar base. Turquoise arrowheads, anterograde trains; pink arrowheads, retrograde trains. Note changes in the signal strength of the basal body pools as trains exit or arrive. (D) Kymogram of IFT traffic in the two flagella. The flagellar base and tip, anterograde trains (turquoise) and retrograde trains (pink) are indicated. Bars (C,D) = 2 μm 2 s. (E) Still images of live cells expressing IFT140-sfGFP (IFT-A; green), NG-IFT20 (IFT-B, red), KAP-GFP (anterograde motor; turquoise) and D1bLIC-GFP (retrograde motor; purple), each of which pool near the two flagella-bearing basal bodies. 10-frame average images are shown for clarity. Bar = 1 μm. (F) Schematic presentation of the distribution of IFT proteins shown in E in the pool in top and side view based on focal series. (G) Model of IFT train assembly. IFT precursor complexes are recruited from the large cell body pool to the basal bodies and assembled into trains by sequential addition of the distinct subcomplexes; complete trains will enter the flagellum. Panels B–D are reprinted in modified form Wingfield et al. 2017 [148].

