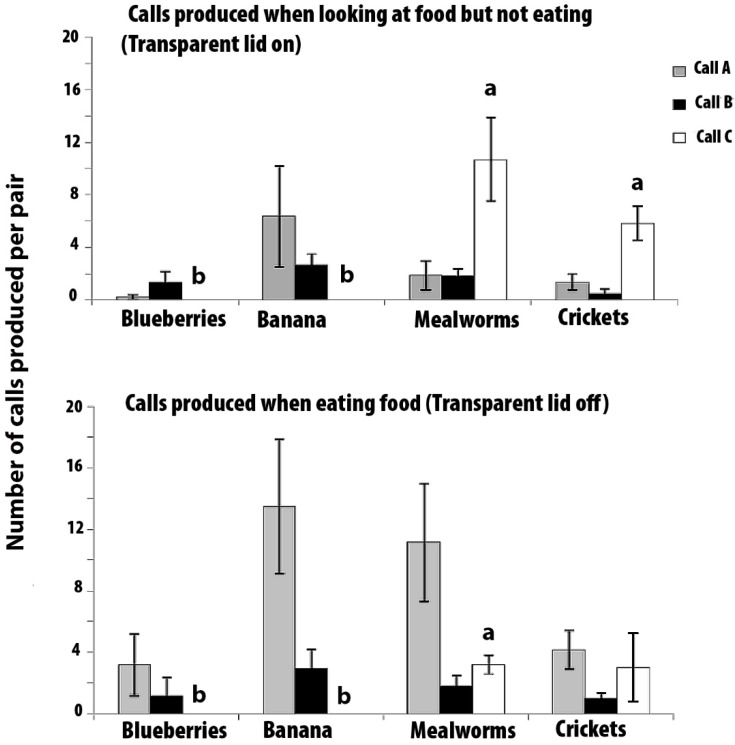
Figure 3.
Experiment 2. The mean number of calls produced during the 3 min periods with the transparent lid-on (top graph) and lid-off (bottom graph). The data are for marmosets tested in pairs (N = 6 pairs). Standard error bars are indicated. Grey bars for Call A, black bars for Call B, and white bars for Call C. Bars marked with (a) differ significantly from those marked with (b).

