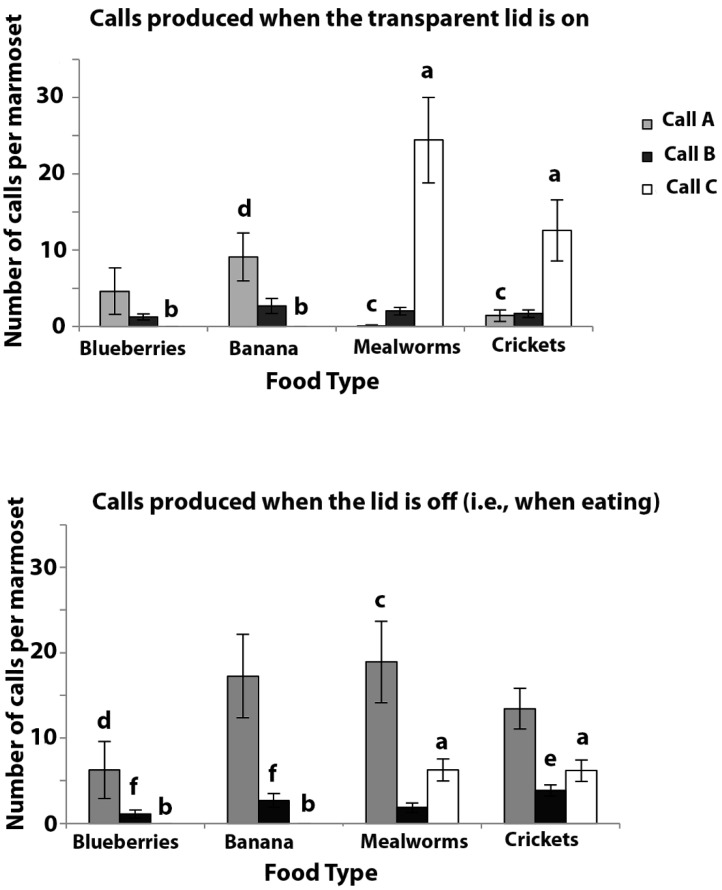
Figure 4.
Experiment 3. These data are presented as in Figure 3 but here each marmoset was tested alone and N = 12. Bars marked with (a) differ significantly from those marked with (b), those marked (c) differ significantly from those marked (d) and similarly for those marked (e) versus (f).

