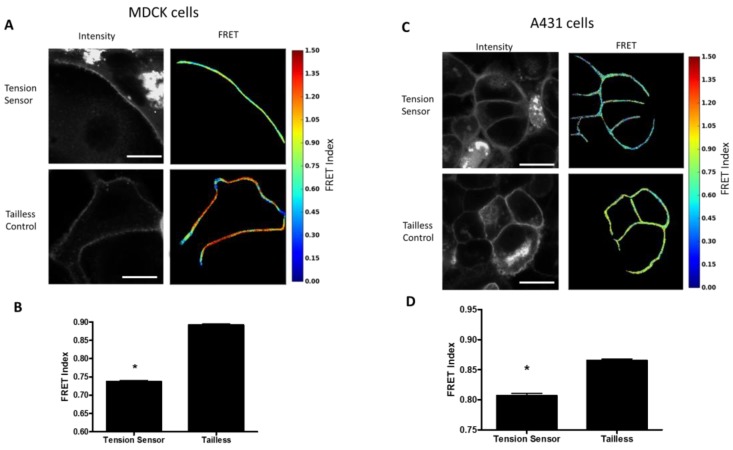
Figure 3.
DSG-2 is under tension in resting epithelial cells. (A) MDCK cells expressing the DSG-2 tension sensor had reduced FRET compared to MDCK cells expressing the DSG-2 tailless control. Scale bar is 20 microns. (B) Quantification of FRET differences (representative experiment of five experiments with similar results, ANOVA with Newman-Keuls post-hoc test * p < 0.001). (C) A431 cells expressing the DSG-2 tension sensor had reduced FRET compared to A431 cells expressing the DSG-2 tailless control. Scale bar is 20 microns. (D) Quantification of FRET differences (representative experiment of three experiments with similar results, ANOVA with Newman-Keuls post-hoc test * p < 0.001).

