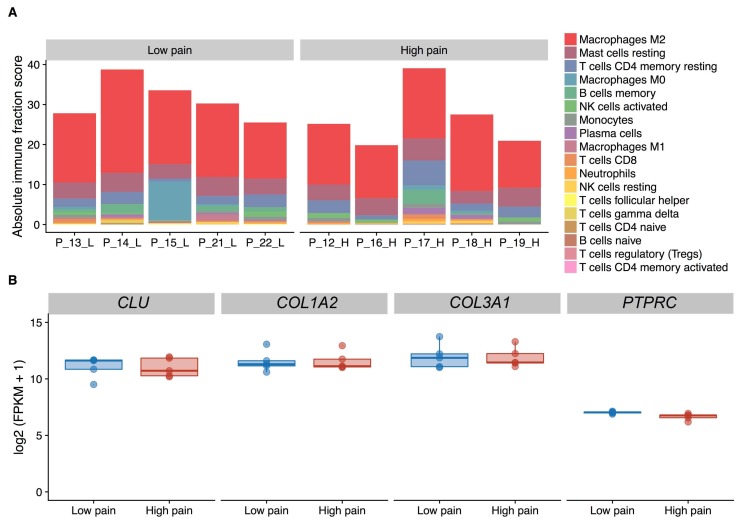
Figure 1.
Deconvolution analysis of the cell composition in synovial tissue extracts based on RNA-sequencing data. (A) Fraction of leukocyte type content as inferred by CIBERSORT. (B) Expression levels of fibroblast (CLU, COL1A2, COL3A1) and leukocyte (PTPRC) marker genes. FPKM, Fragments Per Kilobase Million.

