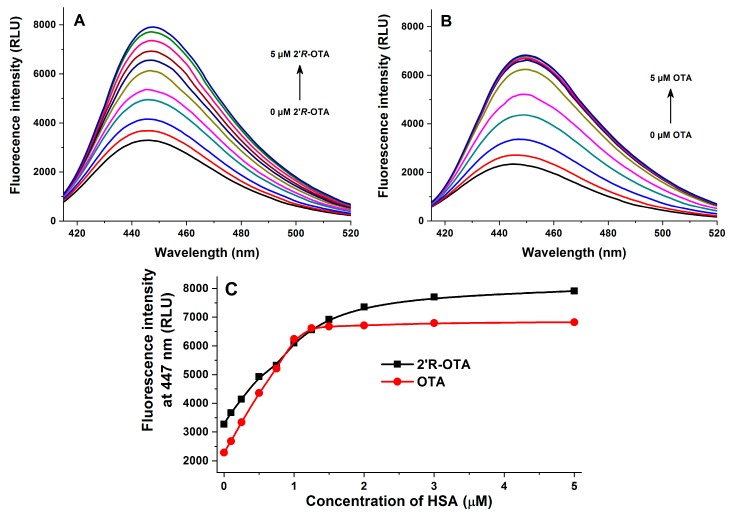
Figure 6.
Fluorescence emission spectra of 2′R-OTA (A: 1 μM) and OTA (B: 1 μM) in the presence of increasing HSA concentrations (0, 0.1, 0.25, 0.5, 0.75, 1.0, 1.25, 1.5, 2.0, 3.0, and 5.0 μM) in PBS (pH 7.4) using 394 nm as excitation wavelength. Fluorescence emission intensities of 2′R-OTA and OTA at 447 nm (C) (n = 3).

