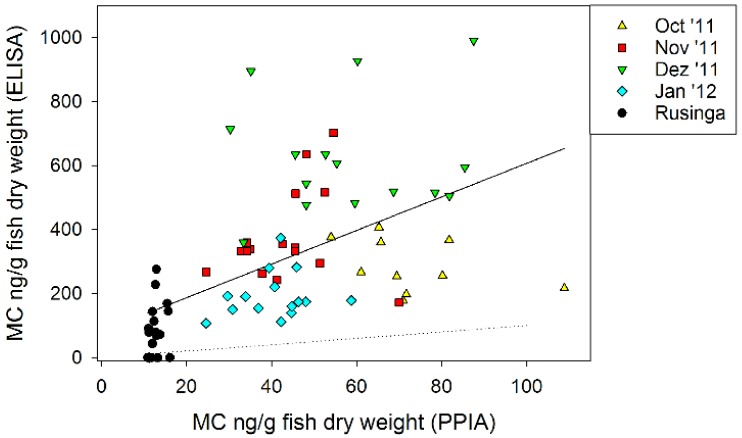
Figure 3.
Correlation of microcystin contents in small fish (ng/g in dry weight) as determined by ELISA vs. microcystin contents as determined by the PPIA (R2 = 0.29, p < 0.0001). The PPIA results were on average 8.2 (±0.5)-fold lower than those obtained by ELISA. The one-to-one relationship is indicated by the dotted line.

