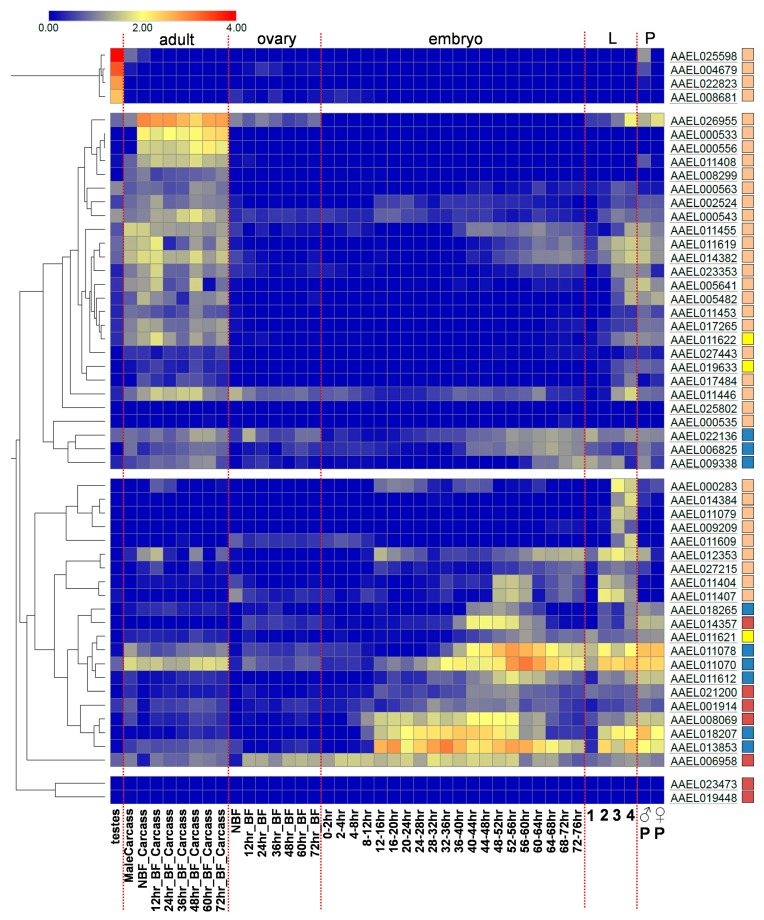
Figure 2.
Developmental expression of A. aegypti mRNA transcripts encoding CTLDcps. Color indicates the log10 FPKM expression value. No scaling is applied to rows; clustering was performed using Morpheus (https://software.broadinstitute.org/morpheus) with one minus pearson correlation and average linkage. CTLD-S (■), -SP (■), -E (■), and -X (■) groups are indicated. NBF, non-bloodfed; BF, bloodfed; L, larvae; P, pupae.

