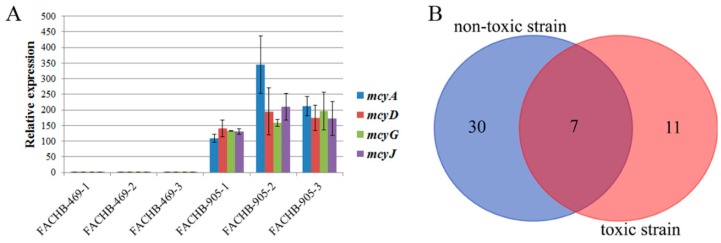
Figure 1.
Expression patterns of mcyA, mcyD, mcyG and mcyJ and Venn diagram of the phosphorylated proteins. (A) Transcript levels of mcyA, mcyD, mcyG and mcyJ in the toxic and non-toxic strains were analyzed by qPCR. FACHB-469-1, FACHB-469-2, FACHB-469-3, FACHB-905-1, FACHB-905-2 and FACHB-905-3 represent three biological replicates of each strain. The error bars were calculated from the statistical analysis of three technical replicates from the qPCR analysis. (B) Venn diagram showing the number of overlapping phosphorylated proteins identified in the toxic and non-toxic strains.

