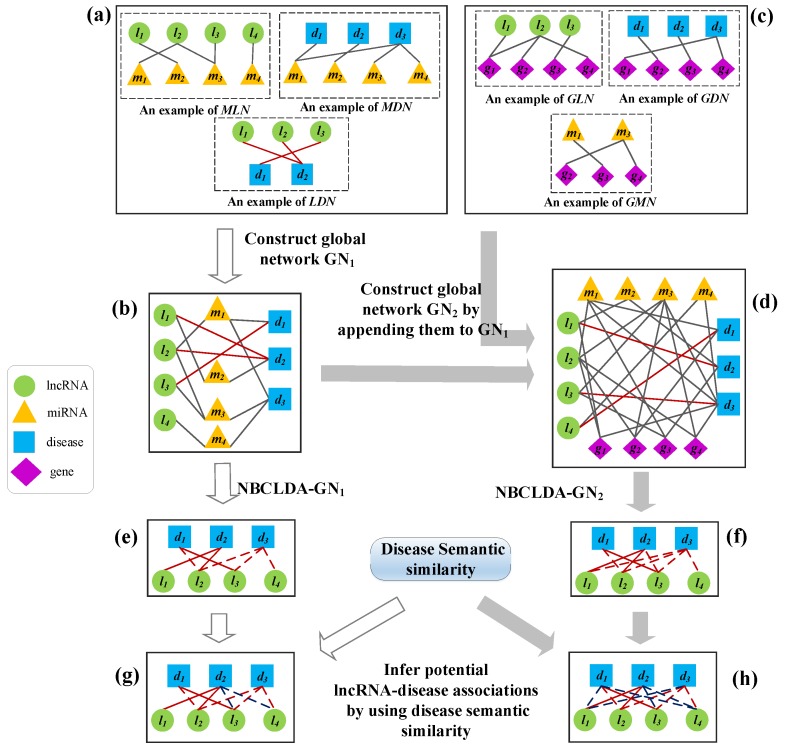
Figure 2.
The flowchart of NBCLDA. In the diagram, the green circles, blue squares, orange triangles, and purple diamonds represent lncRNAs, diseases, miRNAs, and genes, respectively. (a) construction of the MDN, MLN, and LDN; (b) construction of global tripartite network by integrating the MDN, MLN, and LDN; (c) construction of the GDN, GLN, and GMN; (d) construction of the global quadruple network by appending the GDN, GLN, and GMN into ; (e,f) construction of the potential lncRNA–disease association network by using the NBCLDA-, and NBCLDA-; (g,h) inference of potential lncRNA–disease associations by using disease semantic similarity. Here, in (e–h), the known lncRNA–disease associations are represented as the solid edges, and the candidate lncRNA–disease associations are represented as dashed edges.

