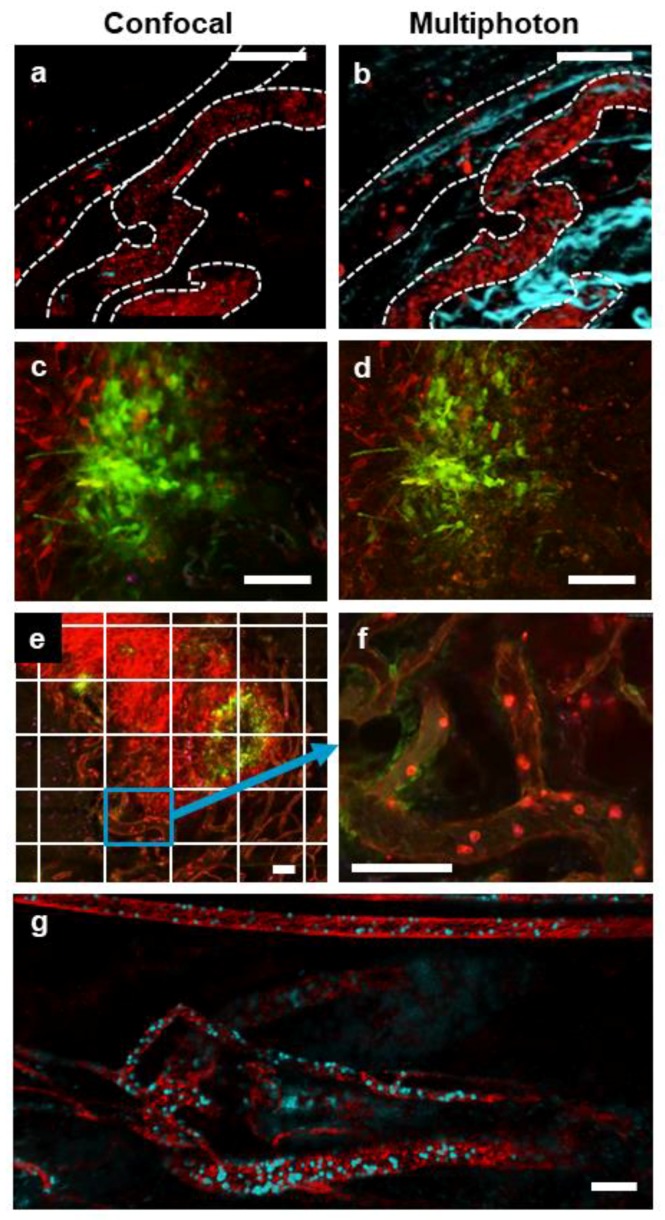
Figure 2.
IVM of tumor vasculature acquired with resonant scanning confocal or multiphoton imaging modalities. Representative images of a single field of view showing a subcutaneous CT-26 tumor vasculature (red; phycoerythrin (PE)-conjugated anti-CD31 and PE-conjugated anti-CD49b, blood vessels are denoted by a dotted white outline) captured with either confocal (a) or multiphoton (b) imaging (collagen appears blue as a result of second-harmonic generation). In the confocal image (a), some CD8+ cells (blue; eFluor 660-conjugated anti-CD8α) are visible; however, these cells are not seen in the multiphoton image (b) because of a lack of fluorophore stimulation by the single multiphoton excitation wavelength used in this imaging. Confocal (c) and multiphoton (d) imaging of a subcutaneous CT-26 tumor (red) infected with VSV that is transgenic for GFP (VSVΔM51-GFP; green). A stitched, tile scan image (e) of an entire subcutaneous CT-26 tumor (bright red) demonstrating localized VSV infection (green) was captured using resonant scanning confocal imaging. Note each tiled image (outlined by the white grid) was captured as a high-resolution video (f) allowing for later analysis at the cellular level (neutrophils in bright red, endothelium in dim red, i.v.-delivered eFluor 660-labelled VSVΔM51-GFP in blue). High-resolution 4D movies of stitched images (g) of the tumor vasculature of a rhabdomyosarcoma within the gastrocnemius muscle (red; PE-conjugated anti-CD31 and PE-conjugated anti-CD49b), containing neutrophils (cyan; BV421-conjugated anti-Ly6G) captured using multiphoton microscopy. The white scale bar represents 100 µm. Images in (a,c,e,f) were captured using resonant scanning confocal microscopy, whereas images in (b,d,g) were captured using resonant scanning multiphoton microscopy.

