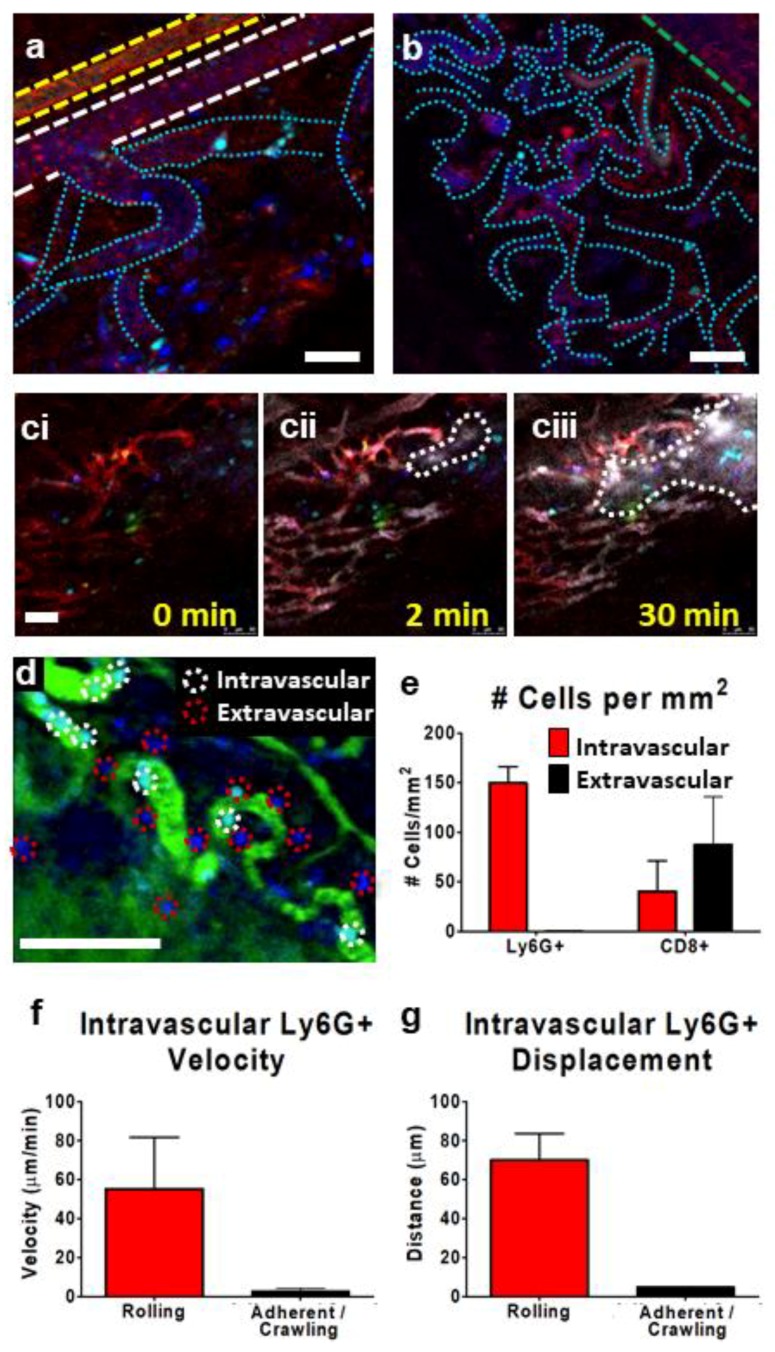
Figure 4.
Characterization of subcutaneous CT-26 tumor microvasculature and leukocyte behavior. Representative IVM images (a–c) show the tumor microvasculature. The vasculature is highlighted by the presence of circulating platelets (red; PE-conjugated anti-CD49b), neutrophils (cyan; BV421-conjugated Ly6G), and CD8+ leukocytes (blue; eFluor 660-conjugated anti-CD8) (a,b). Using resonant scanning confocal microscopy, arterioles (yellow outline, a), veins (green outline, b) were seen as parallel unbranching structures. Venules were seen as narrower than veins and appeared as branching vessels (white outline, a), whereas capillaries/tumor microvasculature appeared as very narrow, convoluted vessels (cyan outline, a,b). Intravenous administration of fluorescent nanoparticles (Q-tracker; grey) identified areas of vascular leakage and accumulation of dye in the tissue interstitium (outlined in dotted white line) (ci–ciii). The introduction of FITC-conjugated albumin (green) allowed for an easy determination of intravascular (red circles) or extravascular (white circles) leukocytes (d). Quantification of intravascular (red) or extravascular (black) neutrophils (Ly6G+) and cytotoxic T cells (CD8+) (cells present for ≥3 min) within the tumor microvasculature (e). Velocity (f) and displacement (g) of rolling and adherent and crawling neutrophils as measured over a 10 min imaging period in a subcutaneous CT-26 tumor; n = 3 animals. Data displayed as the mean ± SEM. Total cell counts normalized for the area of each region of interest within each image (i.e., vessel vs. extravascular tissue). The white scale bar represents 50 µm. Images in (a–d) were captured using resonant scanning confocal microscopy.

