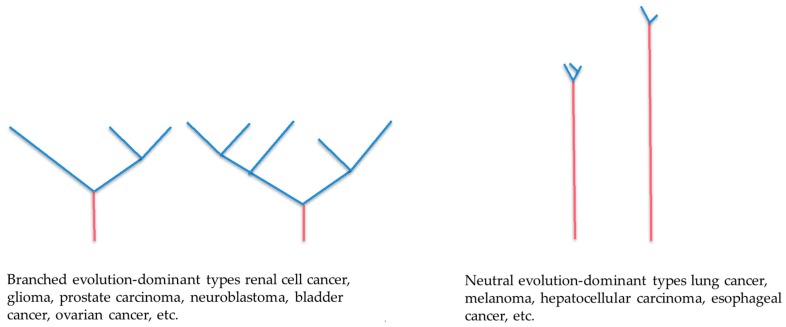
Figure 1.
Phylogenetic trees for the cancer genome. These schemas of genomic evolutionary trees indicate how cancer evolves through branched evolution and neutral evolution. The red and blue line represents a common mutation and a subclone mutation, respectively. The branch length indicates evolutionary distance and is correlated with the number of nucleotide substitutions.

