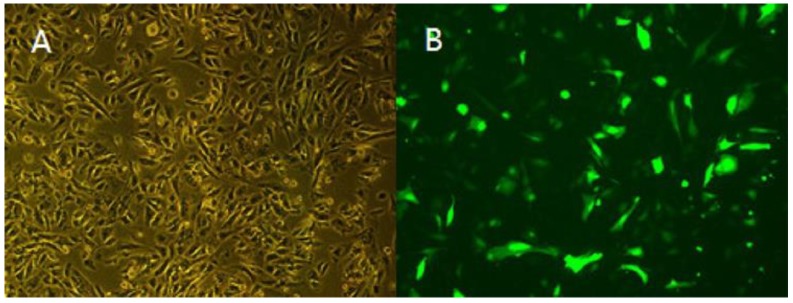
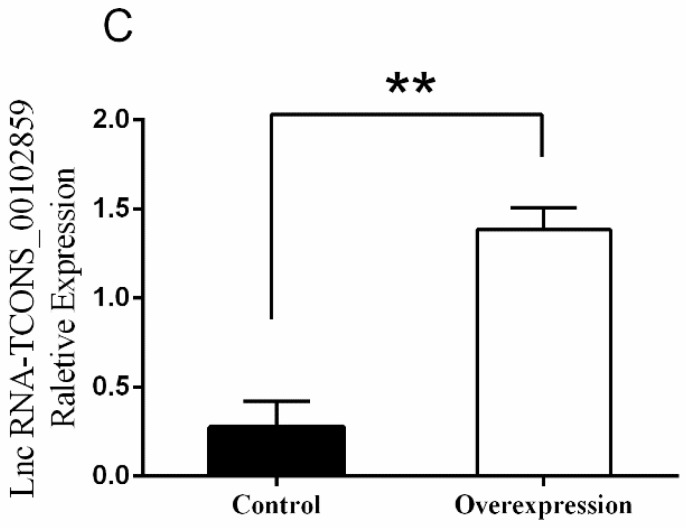
Figure 9.
Fluorescence analysis of myoblasts cells transfected with lentiviral vectors (10×). (A) Positive cells were observed using a light microscope (10×). (B) Positive cells were observed using a fluorescence microscope (10×). (C) Expression level of TCONS_00102859 in myoblasts. The expression level of TCONS_00102859 in test group was significantly higher than that in control (p < 0.01). ‘*’ represents significant difference (p < 0.05) and ‘**’ represents extremely significant difference (p < 0.01).


