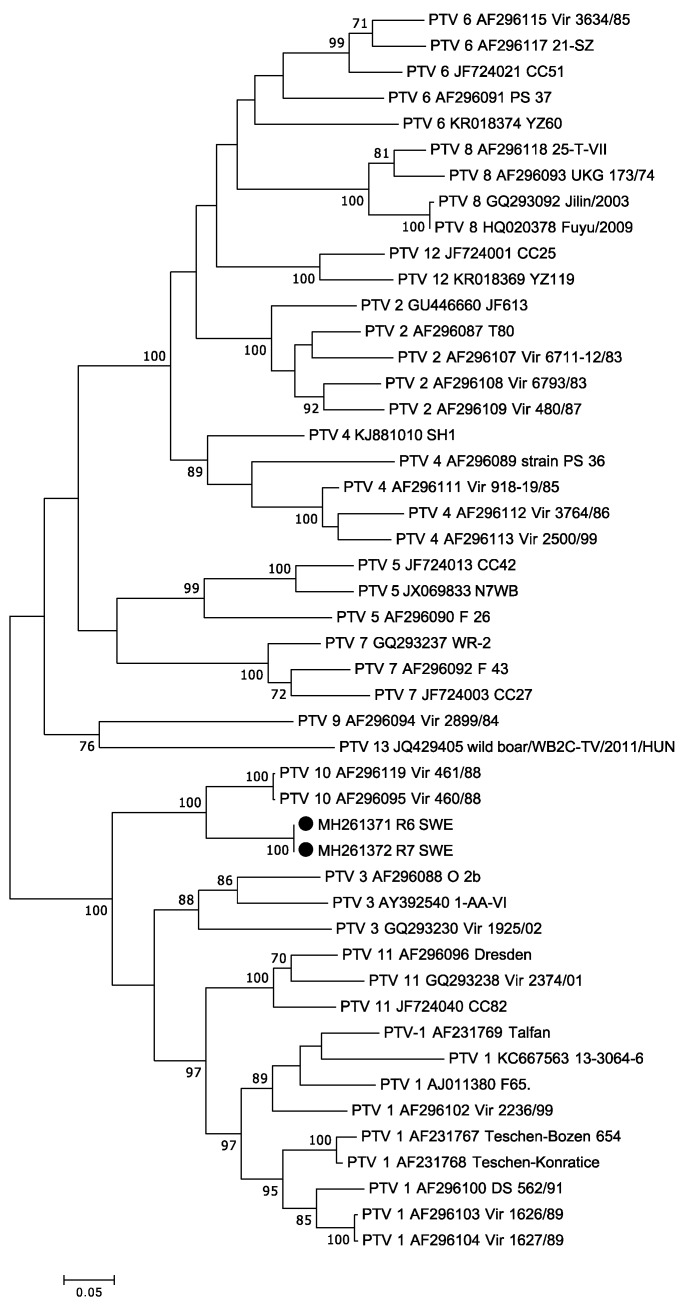
Figure 2.
Phylogenetic analysis of teschoviruses. The evolutionary history was inferred by using the Maximum Likelihood method based on the Tamura Nei model with a bootstrap value of 1000. The P1 nucleotide region encoding for the capsid gene was used; in total, there were 765 nt positions in the final dataset. The teschoviruses obtained from this study are marked with black circles, and only bootstrap values greater than 70% are shown.

