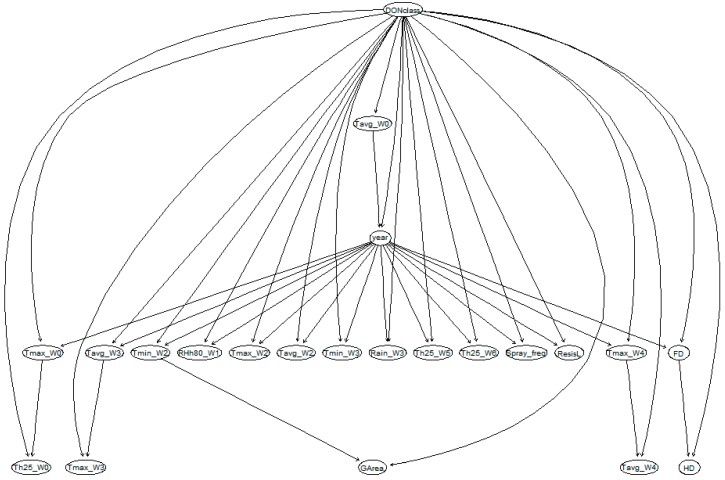
Figure 3.
The Bayesian network model structure resulting from learning the model with field data collected during 2001–2013 in the Netherlands. Circles represent nodes of the Bayesian network model, and arrows indicate the relationship/conditional dependencies among the nodes. Tavg_W0–W4: average temperature in the time windows W0 to W4; Tmax_W0–W4; maximum temperature in the time windows W0 to W4; Tmin_W2–W3: minimum temperature in the time window W2 to W3 ; RHh80_W1: number of hours that relative humidity is higher than 80% in the time window W1; Th25_W0–W5: number of hours that average temperature is higher than 25°C in the time windows W0 to W5; Spray_freq: frequency of fungicides application around wheat flowering for controlling Fusarium head blight; FD: flowering date; HD: harvesting date.

