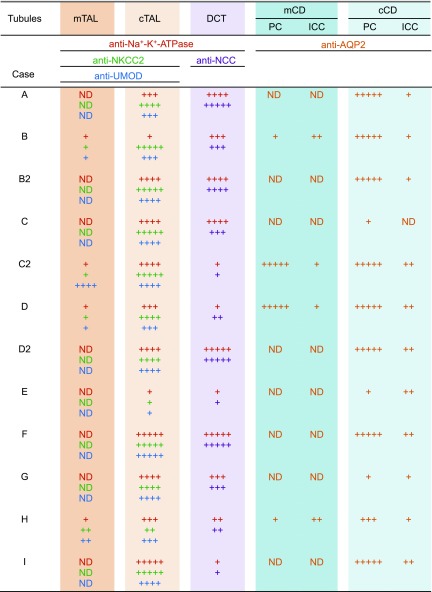
Figure 10.
Attenuated immunoreactivity in renal tubules. Immunoreactivity was scored semiquantitatively according to the proportion of affected cells of the most impaired nephron in the sample as follows: +++++, normal staining; ++++, attenuated staining ≤1/4 of cells; +++, >1/4 and ≤1/2 of cells; ++, >1/2 and ≤3/4 of cells; and +, >3/4 of cells. Scattered intercalated cells (ICCs) were scored separately as follows: ++, normal staining; +, attenuated staining. Profiles of patients with Fabry nephropathy are presented in Supplemental Table 3. cCD, cortical CD; cTAL, cortical TAL; mCD, medullary CD; ND, not detectable; PC, principal cell.

