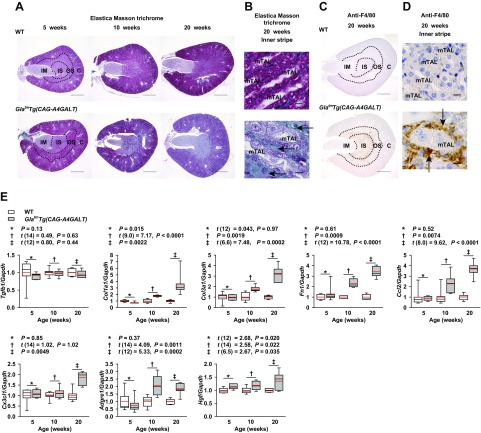
Figure 5.
GlatmTg(CAG-A4GALT) mice demonstrate fibrosis and inflammation. A) Representative micrographs of elastica Masson trichrome staining in kidneys of GlatmTg(CAG-A4GALT) and WT mice (n = 3/group). Scale bars, 1 mm. B) Micrographs of elastica Masson trichrome staining of the inner stripe of GlatmTg(CAG-A4GALT) and WT mice. Arrows indicate interstitial fibrosis. Scale bars, 10 μm. C) Representative micrographs of F4/80-positive macrophage infiltration in GlatmTg(CAG-A4GALT) and WT mice (n = 3/group). Scale bars, 1 mm. D) Micrographs of F4/80-positive macrophages in the inner stripe of GlatmTg(CAG-A4GALT) and WT mice. Arrows indicate F4/80-positive macrophages. Scale bars, 10 μm. E) Real-time RT-PCR analysis of the expression of genes related to fibrosis [transforming growth factor β (Tgfb)1, collagen type I α 1 chain (Col1a1), collagen type III α 1 chain (Col3a1), and fibronectin (Fn) 1], inflammation [C-C motif chemokine ligand (Ccl) 2, chemokine (C-X3-C motif) ligand (Cx3cl) 1, and adhesion G protein-coupled receptor E (Adgre) 1], and regeneration [hepatocyte growth factor (Hgf)] in the whole kidney of the same mice as in Fig. 4A. In box-and-whisker plots (E), center lines represent the median, limits represent quartiles, whiskers represent the 10th and 90th percentiles, and red lines represent the mean. Differences between groups were evaluated by using Student’s t test; data are shown as t (integral degree of freedom) = t, P. For Welch’s t test, data are shown as t (mixed decimal degree of freedom) = t, P. For the Wilcoxon rank-sum test, data are shown with a P value only.

