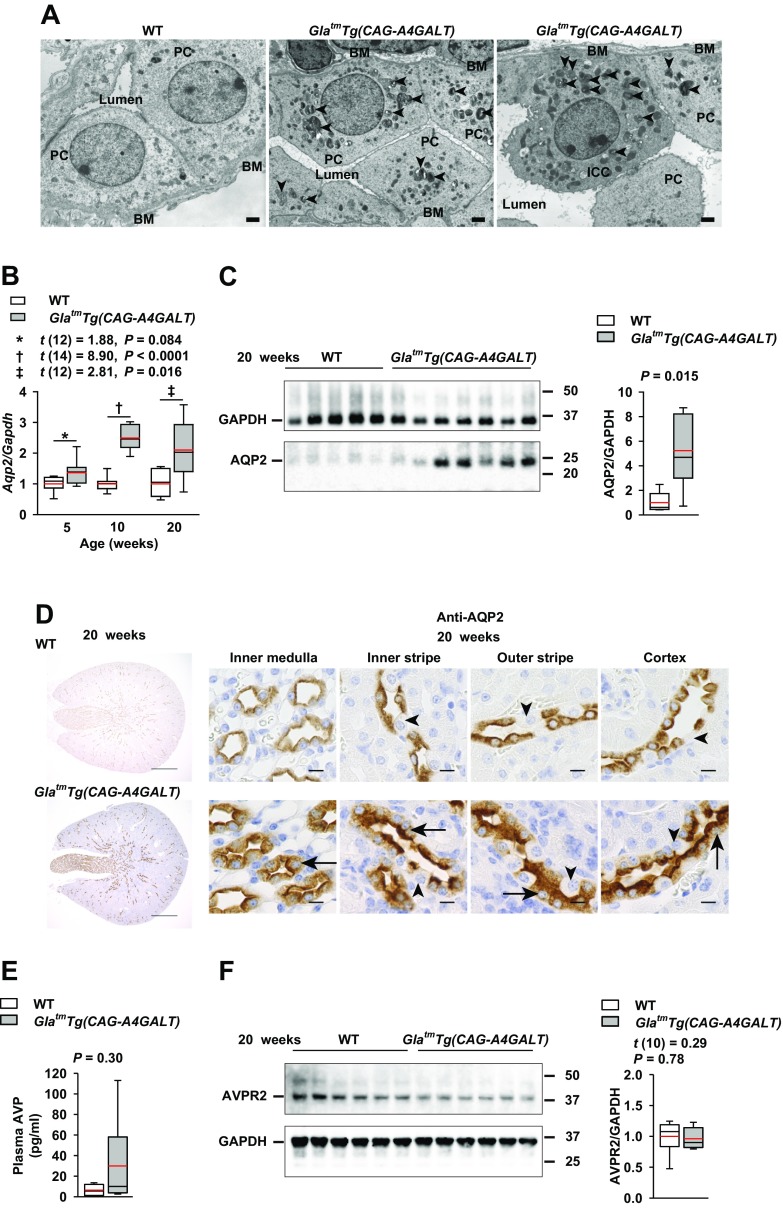
Figure 7.
CD response to TAL dysfunction. A) Representative transmission electron micrographs of a CD in the inner medulla in 20-wk-old GlatmTg(CAG-A4GALT) and WT mice (n = 3/group). Arrowheads indicate a lamellar body. Scale bars, 1 μm. B) Real-time RT-PCR analysis of Aqp2 levels in the same mice as in Fig. 4A. C) Representative (of 2 experiments) Western blot analysis of AQP2 in the same mice as in Fig. 4B. D) Representative images of a PC-specific transporter (AQP2) in a CD of GlatmTg(CAG-A4GALT) and WT mice (n = 3/group). Arrows indicate a swollen PC. Arrowheads indicate an ICC. Scale bars, 10 μm. E) Plasma AVP levels in 20-wk-old GlatmTg(CAG-A4GALT) and WT mice (n = 6/group). F) Representative (of 2 experiments) Western blot analysis of AVP receptor 2 (AVPR2) expression in GlatmTg(CAG-A4GALT) and WT mice (n = 6/group). In box-and-whisker plots (B, C, E, F), center lines represent the median, limits represent quartiles, whiskers represent the 10th and 90th percentiles, and red lines represent the mean. Differences between groups were evaluated by using Student’s t test; data are shown as t (integral degree of freedom) = t, P. For Welch’s t test, data are shown as t (mixed decimal degree of freedom) = t, P. For the Wilcoxon rank-sum test, data are shown with a P value only. ICC, intercalated cell (mitochondria-rich, dark cell); PC, principal cell (light cell).

