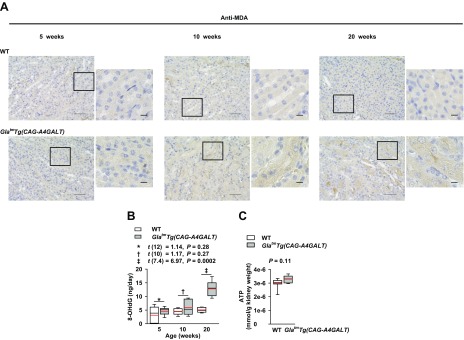
Figure 8.
Oxidative stress in GlatmTg(CAG-A4GALT) mice. A) Representative images of malondialdehyde (MDA) immunoreactivity in GlatmTg(CAG-A4GALT) and WT mice (n = 3/group). Scale bars, 50 (left) and 10 μm (right). B) Time course of 24 h of urinary excretion of 8-OHdG in GlatmTg(CAG-A4GALT) and WT mice. GlatmTg(CAG-A4GALT) mice: 5 (n = 7), 10 (n = 6), and 20 wk old (n = 7); WT mice: 5 (n = 7), 10 (n = 6), and 20 wk old (n = 7). C) ATP content in the whole kidney of 20-wk-old GlatmTg(CAG-A4GALT) (n = 6) and WT (n = 9) mice. In box-and-whisker plots (B, C), center lines represent the median, limits represent quartiles, whiskers represent the 10th and 90th percentiles, and red lines represent the mean. Differences between groups were evaluated by using Student’s t test; data are shown as t (integral degree of freedom) = t, P. For Welch’s t test, data are shown as t (mixed decimal degree of freedom) = t, P. For the Wilcoxon rank-sum test, data are shown with a P value only.

