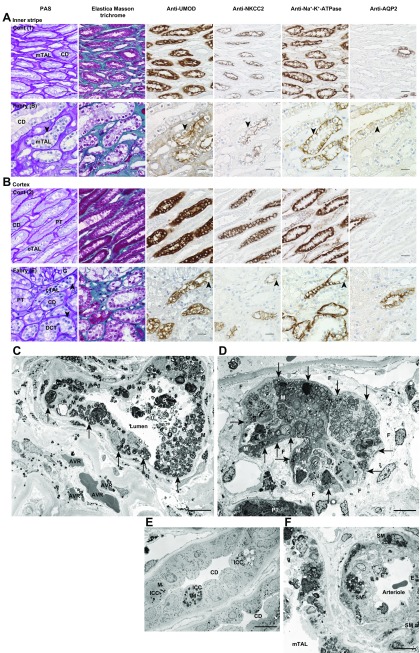
Figure 9.
Micrographs of kidney biopsy serial sections (A, B) and transmission electron micrographs of kidney biopsy sections (C–F) from patients with Fabry nephropathy. PAS, elastica Masson trichrome, anti-UMOD Ab, anti-NKCC2 Ab, anti-Na+-K+-ATPase Ab, and anti-AQP2 Ab staining. A) Inner stripe: upper row, control [Cont (1)] lower row, Fabry nephropathy [Fabry (B)]. B) Cortex: upper row, control [Cont (2)]; lower row, Fabry nephropathy [Fabry (E)]. Impaired cells displayed vacuolization by PAS staining and attenuated or negative immunoreactivity (arrowheads). Fabry nephropathy patients were naive to enzyme replacement therapy at the time of kidney biopsy. Profiles of Fabry nephropathy [Fabry (B) and (E)] and control [Cont (1) and (2)] patients are shown in Supplemental Tables 3 and 4, respectively. Scale bars, 20 μm. C) mTAL of patient A. D) Cortical TAL (cTAL) of patient I. E) CD of patient A. F) Arteriole of patient A. Arrows indicate basolateral infolding. Scale bars, 10 μm. AVR, ascending vasa recta; E, endothelial cell; F, fibrosis; G, glomerulus; ICC, intercalated cell; M, mitochondria; S, sloughed lamellar body; SM, smooth muscle cell.

