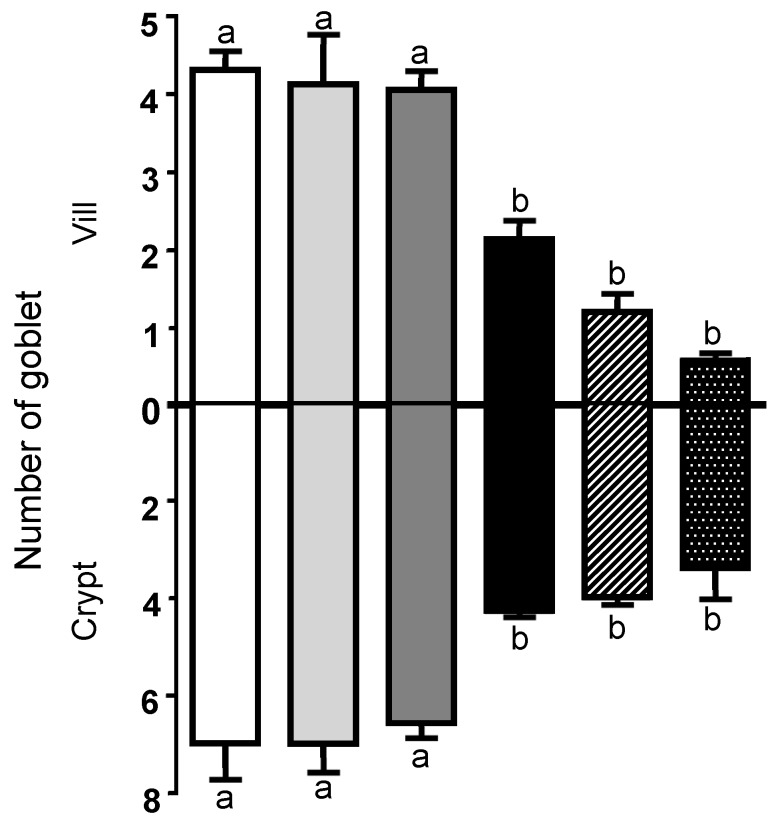
Figure 2.
Mean goblet cell number on villi and crypts of swine jejunal tissue submitted to different treatments: control (□), 0.025 mg·mL−1 of COS (25COS) ( ), 0.05 mg·mL−1 of COS (50COS) (
 ), DON (10 µM) (■), 25COS plus DON (25COS + DON) (
 ), and 50COS plus DON (50COS + DON) (
 ). Values are mean ± SEM represented by vertical bars. Means with unlike letters (a, b) differ significantly by Tukey’s test (p < 0.05).

