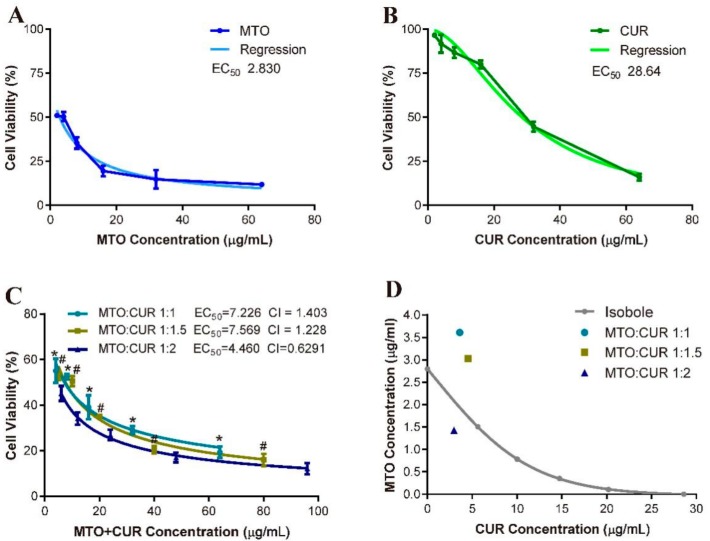
Figure 8.
Dose–effect curves and regressions of: free MTO (A); and free CUR (B); the combination of MTO and CUR at the combination ratio of 1:1, 1:1.5 and 1:2 (C); and the isobole (D). Data represent means ± SD (n = 6). Statistics: * indicates significant differences between the models of MTO:CUR at 1:1 and 1:2 (p < 0.05); # indicates significant differences between the models of MTO:CUR at 1:1.5 and 1:2 (p < 0.05).

