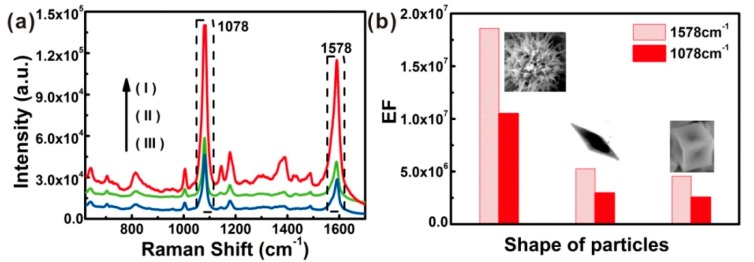
Figure 9.
(a) The Raman spectra of the different substrates after dropping 20 μL 10−5 M 4-ATP ethanol solution and drying. The objective was 50× telephoto, laser power was 2 mW, and the acquisition time was 5 s. Curves (I), (II), and (III) correspond to the films built of the chestnut-like Au nanocrystals, the Au nanospindles, and the concave Au nanocubes, respectively. (b) Enhancement factors at the peaks at 1078 cm−1 and 1578 cm−1 for the different Au nanocrystal-built films.

