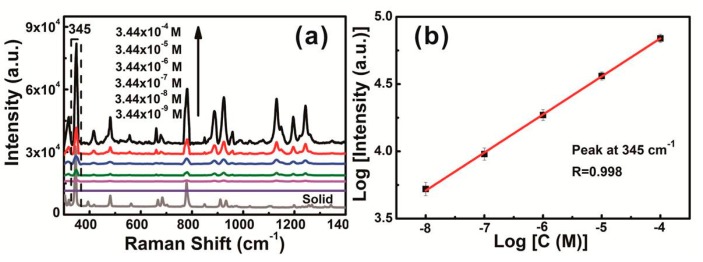
Figure 10.
(a) The surface enhanced Raman scattering (SERS) spectra of γ-666 obtained from chestnut-like Au nanocrystal films, the concentrations varying from 3.44 × 10⁻⁴ M to 3.44 × 10⁻⁹ M, and drying. The bottom curve is the spectrum of solid γ-666. The objective was 50× telephoto, laser power was 2 mW, and the acquisition time was 5 s. (b) The relationship between SERS intensity I at 345 cm−1 and concentration C meets the double logarithm linear. R is the correlation coefficient.

