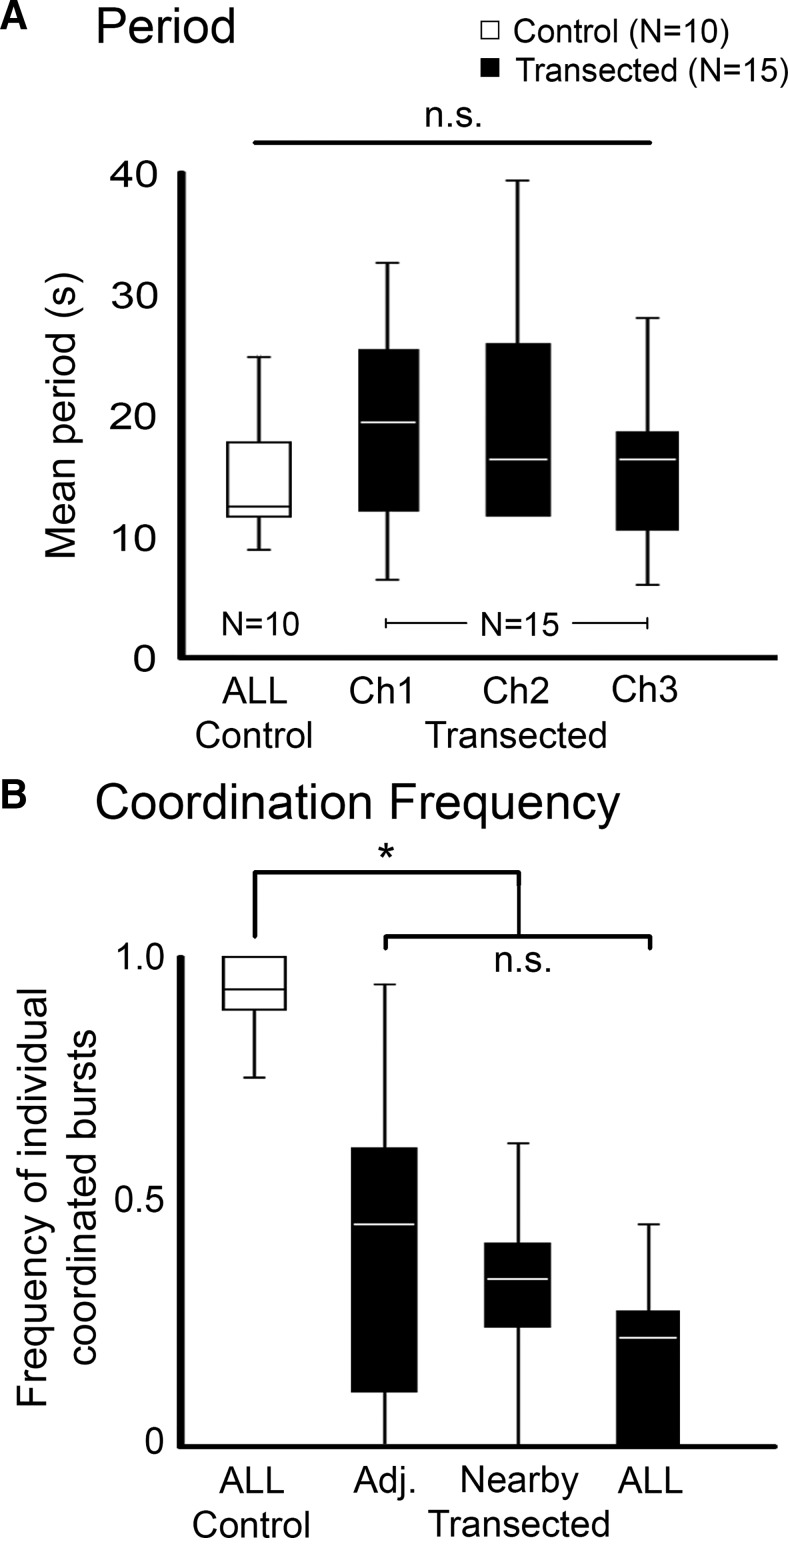
Figure 3.
Quantification of whole recovered cord data. A, Boxplots of the mean cycle period of DE-3 bursting of isolated whole nerve cords treated with dopamine. White boxes are from controls (n = 10) and black boxes from M2/M3 transected and recovered leeches (n = 15). Note: The periods of the three DP nerves in the controls were isochronous, so only one box is shown. For preparations from transected and recovered leeches, each channel analyzed is shown. Lines within the boxes denote the median, and the box range denotes the 25th–75th percentiles. Error bars denote the entire range of the dataset. No statistical differences were found between the groups (n.s., Kruskal–Wallis H test, p > 0.5) B, Boxplots showing the frequency of observing crawl-specific coordination of individual DE-3 bursts. White boxes are from untransected control preparations. The black boxes depict the frequency of coordination between two adjacent ganglia (Adj.), ganglia within 2–3 segments from one another (Nearby), and among all ganglia recorded in a preparation (ALL). Box plot parameters are the same as in A. *, statistically significant difference between the control and transected/recovered groups (p < 0.01). No significant differences were observed among the transected recordings (n.s.; Kruskal–Wallis H test, p > 0.5).

