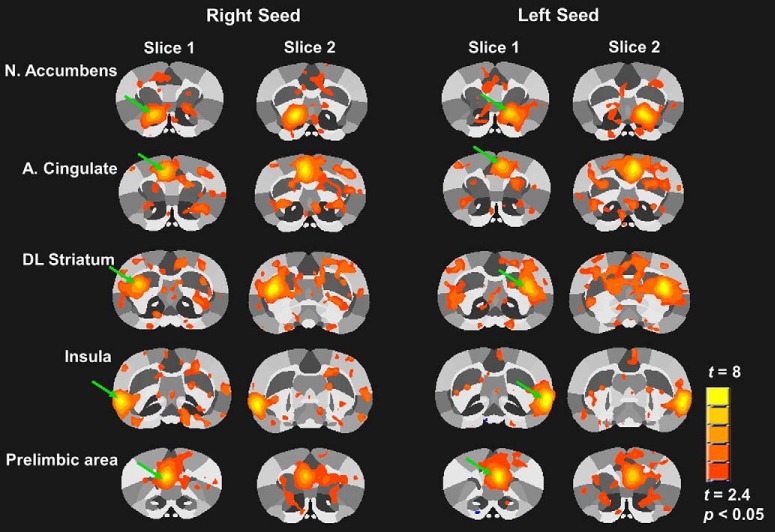
Figure 3.
Seed-based functional connectivity maps illustrating left and right hemisphere seeds for striatal and cortical regions. Maps are composite statistical maps from the chamber exposure control group at baseline. Regions showing significant functional connectivity with the seed region are displayed (uncorrected threshold, t > 2.4, p < 0.05). Green arrows indicate the seed region in each map. Each region shows 2 contiguous slices of 12 total coronal slices scanned from rostral to caudal in the brain.

